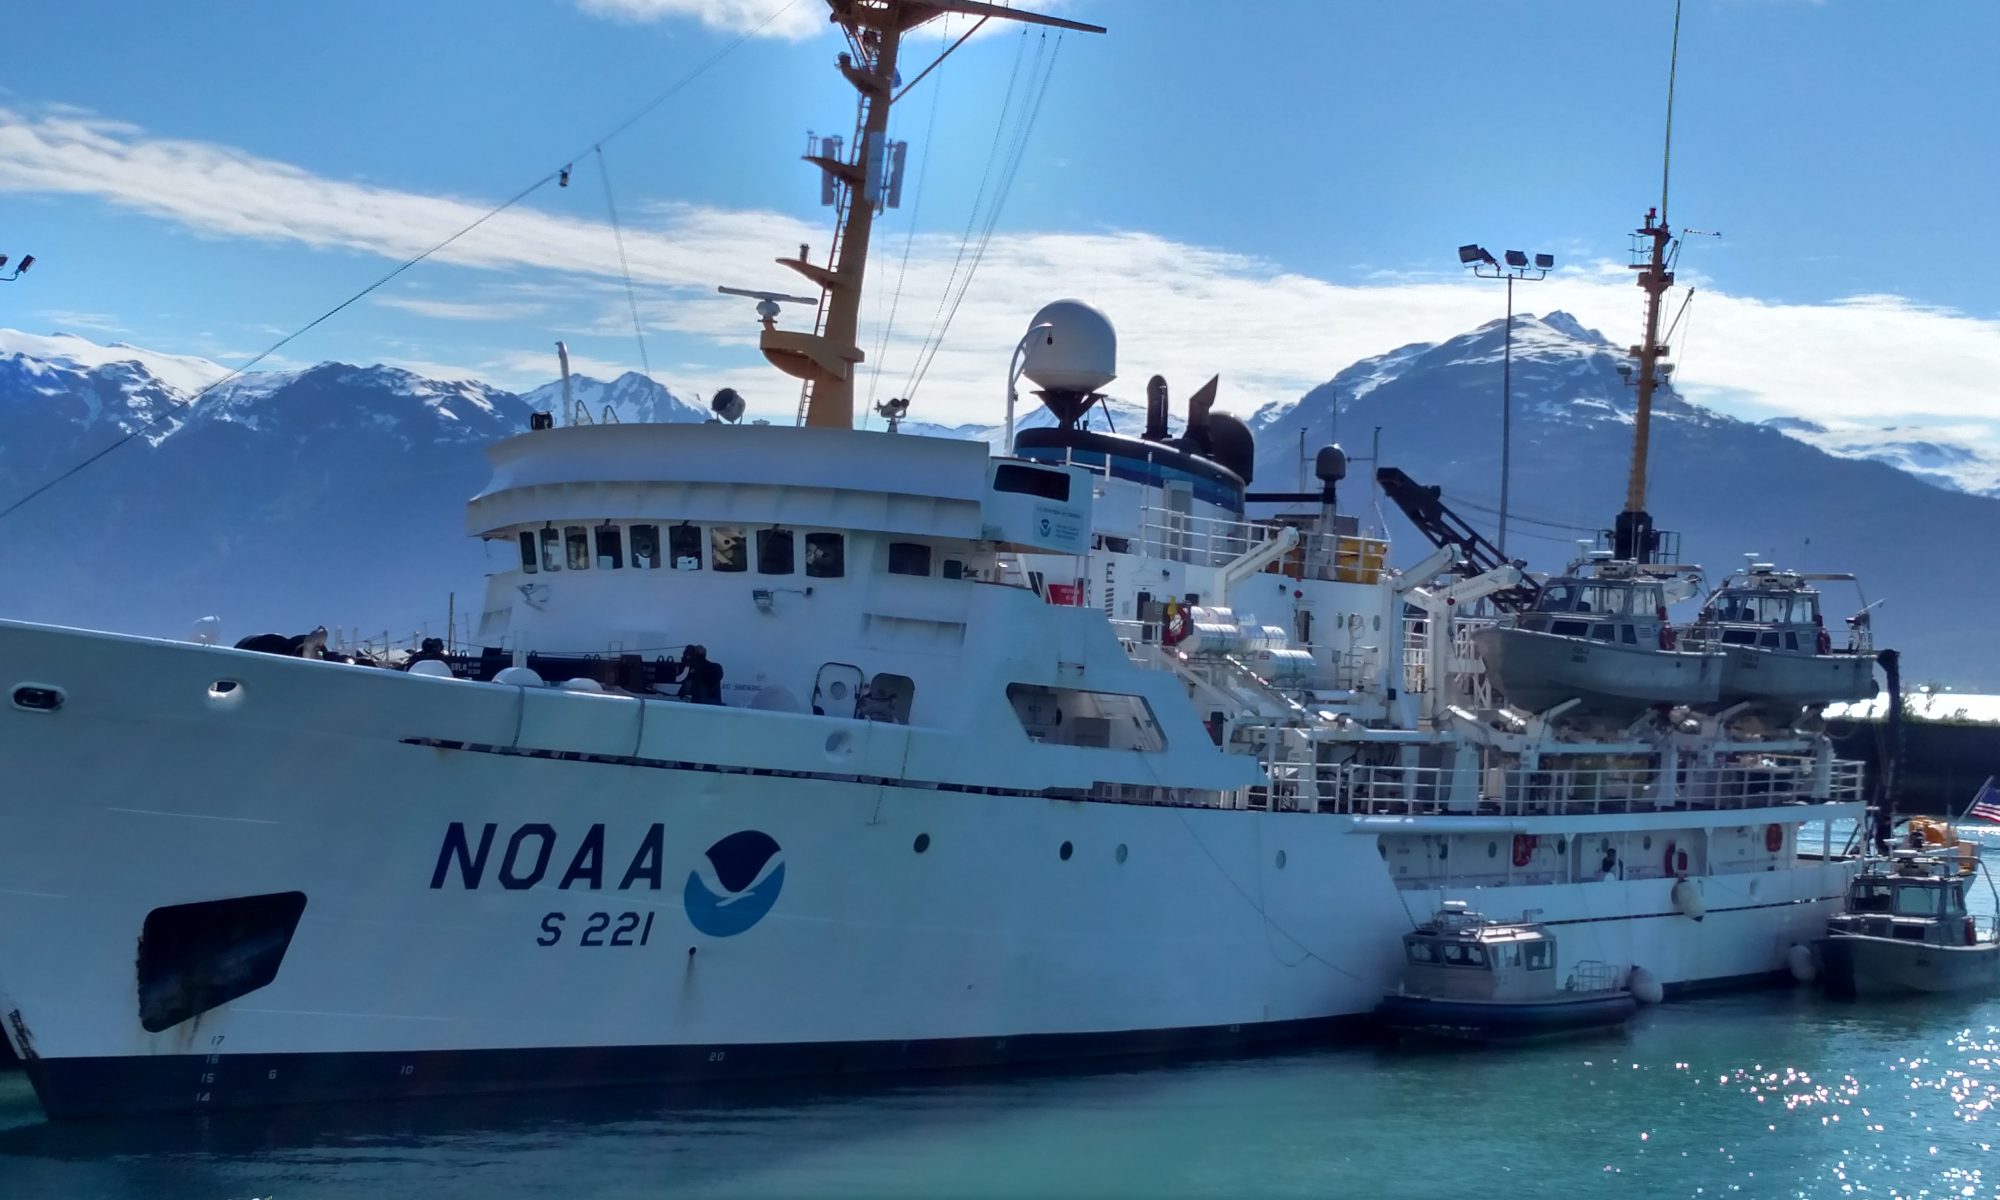
Chuck Gregory, August 13, 2007

NOAA Teacher at Sea
Chuck Gregory
Onboard NOAA Ship Thomas Jefferson
August 12 – 24, 2007

Mission: Hydrographic Survey
Geographical Area: New York Harbor
Date: August 13, 2007

Chuck's stateroom aboard the NOAA Ship THOMAS JEFFERSON.  During his voyage, Chuck (bottom bunk) shared his stateroom with Ensign Andrew Ostapenko (top bunk).
Chuck’s stateroom aboard the ship. During his voyage, Chuck (bottom bunk) shared his stateroom with Ensign Andrew Ostapenko (top bunk).

“He who knows best knows how little he knows.” ~Thomas Jefferson

Andy’s alarm clock went off around 0600h. I was already awake but comfortable, so I didn’t get up right away. I could hear that one of the Megan’s was using the shower. The staterooms on our deck have an interesting arrangement – two guys sharing a bath (shower and toilet) with two gals (Megan & Megan). The trick is to knock first and, once the coast is clear, to enter and lock the gal’s door from the inside.  But the real trick is to remember to UNlock the gal’s door before leaving. Stay tuned…

After Andy used the shower it was my turn.  I’ve used smaller showers, but not much smaller.  The water pressure was good, and the temperature comfortable.  I am now awake!  I quickly dressed and went to the Mess Hall to catch up on some eating.  I met the CO, and a few other crew. I also met Tom who is from the NOAA office in Silver Springs, Maryland (near DC). He is on board to observe and get a better idea what the ships do to gather the data.  Breakfast was simple (I am trying to lose about 10 lbs.) – cereal, fruit and coffee – and I was off to take a few pictures before we headed out to sea.

The morning sky is clear and the day will be hot, so it’s probably a good thing we are going to be on the water. Next to us on the pier a group of visitors was getting the tour of the USS INTREPID. Manhattan and the surrounding area was enshroud in a gray haze.  It’s going to be a learning day and I have a lot to learn.  For now, I think it’s time for me to stop writing and take my Dramamine.

The Plan of the Day (Day #225) for the THOMAS JEFFERSON is as follows:
Sunrise = 0604h Sunset = 1958h 0000h
Ship moored alongside Stapleton Pier, Staten Island, NY 1100h
Ship underway 1130h
Deploy 31’ Launches (3101 & 3102) 1215h
Anchor @ Sandy Hook Anchorage 1545h
Retrieve launches

Tides for Sandy Hook Low @ 0258h (-0.2 ft.) & 1459h (0.2 ft.); High @ 0855h (5.0 ft.) & 2105h (5.6 ft.)  Currents in Sandy Hook Channel Flood: 0604h (2.0 kts.) & 1814h (2.3 kts.); Ebb: 1212h (1.6 kts.) & 0041h (1.7 kts.)  Weather from Sandy Hook to Fire Island AM: W winds 10-15 kts., seas 2-3 ft.; PM: NW winds 10 kts., seas 2 ft.

Today was a learning day as I wanted to learn more about the bathymetry instruments. The THOMAS JEFFERSON is equipped with a Klein 5000 Side Scan Sonar (aka SSS Fish).  Informative place settings dot the mess hall and I was able to learn the basics of the equipment from them:

“The side-scan sonar is NOT just like a photo of the ocean floor.  Objects get “stretched and distorted”. They need to be interpreted.”

“The SSS Fish data can be affected by: 1) tides, 2) survey speed, 3) sea conditions, 4) angle of incidence of sound waves, 5) launch (or ship) attitude (roll, yaw & heave), 6) etc.”

“When sound waves from the SSS Fish are reflected off an object a dark or “hard” return is created in the data. The object blocks the sound waves from traveling beyond it, which creates a “light colored shadow”.

“Unlike Multibeam Sonar, side-scan sonar created better images of the bottom when objects are off to the side, rather than directly beneath the instrument.”

“Side-scan sonar sends out an acoustic pulse out both sides of the vessel.  The intensity of the acoustic reflection from each side is measured for a period of time.  An image of a stripe of sea bottom is made with each pulse.”

At 1730h I met with Peter the hydrosurvey data technician and observed him downloading today’s data. Peter applied a series of corrections (heave, tide and sound velocity) to the data. This time consuming process took about two hours.  This data will be sent to NOAA’s Atlantic Hydrographic Branch (AHB) where it will be reviewed, checked, cross checked, and additional data will be added if needed (e.g., from Army Corp).  The raw data is also sent to the National Geographic Data Center in Boulder, CO where it is archived. From AHB the data is sent to NOAA’s Chart Division where it is made into the navigation charts we commonly use.  FOO and Acting XO Chris informed me I will be going on one of the launches tomorrow.  #3102 with SSS Fish and Multibeam (MBES).  I can’t wait.  I’m going to need a good night’s sleep as we’ll be on the launch for about 10 hours!  Good night!!

Chuck Gregory, August 12, 2007

NOAA Teacher at Sea
Chuck Gregory
Onboard NOAA Ship Thomas Jefferson
August 12 – 24, 2007

Mission: Hydrographic Survey
Geographical Area: New York Harbor
Date: August 12, 2007

“Determine never to be idle. No person will have occasion to complain of the want of time who never loses any. It is wonderful how much may be done if we are always doing.” 

~Thomas Jefferson

NOAA Teacher At Sea, Chuck Gregory, getting ready to leave from Portland, Maine. His destination is LaGuardia airport on Long Island, and from there, the NOAA Ship THOMAS JEFFERSON tied up to the Stapleton Pier on Staten Island.

I left the Portland, Maine Jetport at 1:55 pm for LaGuardia on US Airways. A nice, short flight. About 1 hour later we landed on Long Island. It was a beautiful day to fly.  After a 45 minute wait for my duffel bag I grabbed a cab for the ride to Staten Island and 355 Front Street.

At 1610h – and $70 later (including tip) – we pulled up to the NOAA Ship THOMAS JEFFERSON (affectionately called the ‘TJ’). She was docked on the northern side of the Stapleton pier, hidden by the retired USS INTREPID – an “old” (commissioned by the Navy in 1943) aircraft carrier now acting as a floating sea, air and space museum.  You may remember the USS INTREPID as the aircraft carrier that got stuck in the Hudson River mud not to long ago.  No wonder, she is 872 feet long and an overall beam of almost 150 feet! And very, very gray.

In the distance, off the northern side of the pier is (from left to right) the Staten Island Ferry and piers, New Jersey, the Statue of Liberty & Ellis Island, the entrance to the Hudson River (the west side), Manhattan, the entrance to the East River (the east side), Governors Island, and Long Island (Queens & Brooklyn).  In the foreground is the Inner Harbor of New York bustling with tankers, tugs, and ferries.  Not many recreational boats in sight.

Destination - The NOAA Ship THOMAS JEFFERSON tied up at the Stapleton Pier, Staten Island, NY.
Destination – The NOAA Ship THOMAS JEFFERSON tied up at the Stapleton Pier, Staten Island, NY.

The THOMAS JEFFERSON is a member of the NOAA Fleet.  She was delivered to the Navy in 1992 and commissioned by NOAA in 2003. She is 208 feet long, 45 feet broad, and has a draft of 14ft. She can berth 36 (crew and guests), and is packed with neat equipment (multibeam sonar, side-scan sonar, two 31’ launches, an emergency launch, and more hoses, cables and gizmos than I care to mention).  She is scheduled to leave port tomorrow for 19 days.  I will be getting a ride back to shore after day 12.  The THOMAS JEFFERSON will not return to Staten Island, but head on to her home base of Norfolk, VA.

The first person I met when I crossed the gangway was Ensign Megan Guberski. She is a NOAA Corps Officer and a graduate from Smith College.  She took me down a flight of stairs to my ‘stateroom’ and introduced me to my bunkmate, Ensign Andy Ostapenko.  Andy is another NOAA Corps Officer who works on the important navigation systems.  He is from Minnesota.  He gave me a great tour of the vessel, showing me the six decks, emergency areas and equipment, various stations, bathymetry equipment, etc., etc. Boy do I have a lot to learn. Port, starboard, aft, forward, main deck, amidships, bridge, lounge, computer station, yadda, yadda!  The one term that stuck was “Mess Hall”. It is located just up the main stairway and almost above our room.  Nice location!

Andy and I chatted for about an hour and he kindly answered all of my basic questions – toilet protocol, shower, a good place on the ship to hang out, where to make cell phone calls, what we will be doing for the next 12 days, etc.  He is a really nice person and seems like a great crewmember.  I’m really interested to see him at work doing his navigation thing.  In addition to Andy, I met the Commanding Officer (CO), Commander Tod Schattgen.  Another nice person and easy to talk with. He really seems interested in the various activities occurring on the ship, but not in a controlling way.  I am sure he and I will have more opportunities to talk during the voyage.  I met the FOO (Facilities Operation Officer) and Acting XO, Chris Van Westandorp.  Chris will be my ‘supervisor’ since the regular XO, Jim Crocker, is on leave.

While in the Mess Hall I ran into Engineer Charlie.  A retired Navy person, Charlie was eager to give me the tour of the engine room area.  And what a tour it was. This may be the only time I get to tour the engine area, so I took advantage of the moment.  Engines, air conditioner, water treatment, sewage treatment, compressors, refrigeration systems, control room, workshop, etc., etc. And all compressed into a small space.  There was enough equipment (and back-up equipment) to keep that vessel going for weeks!  And that’s a good thing! Charlie was happy to show me around and give me some ear plugs for the engine room.  It was loud and I needed them!

I’m trying my best to meet everyone on the ship and chat about what they do on THOMAS JEFFERSON and how they “found” NOAA.  In general, it seems like there are two types of crew – the old ex-navy types, and the young recently-graduated types.  A nice mix of both.  Lots of experience able to teach the next generation.  One piece of bad news: I forgot the cable that connects my digital camera to my computer.  While I can take many photos I just can’t send them to NOAA until I return home.  Bummer!

Another piece of bad news: Since I was busy getting the tour of the ship and missed dinner. Not like me, but I was too interested in the ship to stop for food.  Once my initial excitement calmed down I was able to call my wife, Roxann, and have a snack before bed. After a few pages of “Cannery Row” I drifted off and slept quite well.

Candice Autry, August 16, 2006

NOAA Teacher at Sea
Candice Autry
Onboard NOAA Ship Thomas Jefferson
August 7 – 18, 2006

Mission: Hydrographic Survey
Geographical Area: Northwest Atlantic
Date: August 16, 2006

“Experiences on the Fast Rescue Boat” 

TAS Candice Autry prepares to use the CTD instrument which collects water information related to conductivity, temperature, and depth.
Candice Autry prepares to use the CTD instrument which collects water information related to conductivity, temperature, and depth.

Science and Technology Log 

Today I had the opportunity to go out on the Fast Rescue Boat (FRB) to use the conductivity, temperature, depth (CTD) instrument in various places in the harbor.  The CTD looks like a simple white tube; however, the capabilities of the CTD are far from simple!  This devise provides essential data for scientists. Three of us boarded the small FRB, loaded the CTD, and were off to our locations. The first observation noted is that being on the fast rescue boat is a different boating experience compared to the launches and the THOMAS JEFFERSON. The “fast” part of the description is fitting; the boat moves quickly!  The main function of the CTD is to collect data about how the conductivity and temperature of water changes relative to depth. Conductivity and temperature information is important because the concentration of the salt of the seawater can be determined by these two changing variables.

Candice Autry holds the CTD instrument. We collected information from three locations; once in the morning and then again in the afternoon.

The CTD devise can also help surveyors determine the speed of sound in the water. The information from the CTD is used in conjunction with multi-beam sonar providing accurate data about the depths of obstructions on the seafloor. The metal frame seen in the picture on the outside of the mechanism is called a rosette.  We attached a rope to the rosette of the CTD, turned it on to collect data, held the devise in the water for two minutes for adjustment, then lowered the instrument down to the bottom of the seafloor. Once the CTD hits the bottom of the seafloor, the rope is pulled back up, the devise is put back into the fast rescue boat, turned off, and it is off to the next location to collect data.  We deployed the CTD in three different locations in the morning and three different locations in the afternoon. At each place where data collection occurred, the location was recorded by using a global positioning system.  Back on the THOMAS JEFFERSON, the information that the CTD collected is downloaded to a computer where specialized software is used to understand the data.

Personal Log 

All of the experiences on the THOMAS JEFFERSON have been interesting and fun.  Tomorrow I will be helping some of the crew on the deck of the ship.  Exposure to saltwater often causes rust to occur; a ship requires constant maintenance!  I am also realizing that this adventure will be over soon, with less than two days left. Until tomorrow…..

A closer view of the CTD.
Senior Surveyor Peter Lewit shares the chart used as a guide for the launches to collect data. The red lines in the white area of the chart represent the paths the launches took to collect data using side scan sonar and multi-beam sonar technologies.
Surveyor Peter Lewit shares the chart used to collect data. The red lines in the white area represent the paths the launches took.

Candice Autry, August 15, 2006

NOAA Teacher at Sea
Candice Autry
Onboard NOAA Ship Thomas Jefferson
August 7 – 18, 2006

Mission: Hydrographic Survey
Geographical Area: Northwest Atlantic
Date: August 15, 2006

Crew members prepare the launches to collect data using side-scan and multi-beam sonar

Weather 
AM: SW winds 15-20 knots, Seas 1-2 feet
PM: W winds 10-15 knots, Seas 1-2 feet  Chance of showers

Science and Technology Log: Data Collection Begins! 

We have made it to our destination after a thirty-hour journey. It is exciting to get started with data collection, I am curious what is on the bottom of a busy harbor.  After a brief safety meeting that kicks off the morning, we prepare to go out on the launches to begin the process of making a chart that will provide information about obstructions in navigable waters. The teamwork of the crew of the THOMAS JEFFERSON is inspiring to watch, each with a specific duty communicating and working together so that launches are safely deployed.  Today two launches will collect data using side-scan sonar and multi-beam sonar technologies.

The launch is ready to start collecting data. Typically, a launch has a driver, another person to look out for water traffic, and a surveyor who observes the data being collected and who manipulates the computers connected to the "fish" below the launch.
The launch is ready to collect data. Typically, a launch has a driver, a person to look out for water traffic, and a surveyor who observes the data being collected and manipulates the computers connected to the “fish” below the launch.
Bernard Pooser behind the wheel of the launch. The route he drives in the harbor is very specific, and he must follow careful ‘driving lines’ that the surveyor also sees on one of the four computer screens inside of the launch.  This job is much easier said than done, a real challenge!
Bernard Pooser driving the launch in the harbor. The route is very specific and he must follow careful ‘driving lines’ that the surveyor also sees on one of the four computer screens inside of the launch. This job is much easier said than done!
Senior Surveyor Peter Lewit prepares to collect data utilizing side scan sonar. Side-scan sonar provides a picture that shows light and dark images that provide high-resolution images of obstructions on the seafloor.
Senior Surveyor Peter Lewit prepares to collect side scan sonar data, which provides light and dark high-resolution images of obstructions on the seafloor.

The launch I am on today utilizes side-scan sonar, which incorporates sound navigation and ranging that is used for searching for objects on the seafloor. This technology transmits sound energy, which sends a beam from the “fish” (the instrument underneath the launch) that bounces off the seafloor and other objects. Once the sound energy hits the floor, it then bounces back to the fish in the form of an echo. These beams are sent in a fan-shaped pattern that sweeps the seafloor from underneath the launch to approximately 75 meters from either side of the boat (although distances can reach 100 meters).  The strength of the echo is recorded as a “picture” that can be seen on a computer screen.  If there is an object on the bottom of the seafloor, such as a protrusion, the return signal will be strong and will create a dark image on the screen.  If the return signal has a weak return, then the image on the computer will look light.  A tire on the seafloor, or a barge that has sunk is easily seen and depicted! These images are fascinating.

Surveyor Doug Wood observes computer screens where data is being collected. The green triangle is showing multi-beam sonar data.
Surveyor Doug Wood observes computers where data is being collected.

The benefit of side-scan sonar allows for high-resolution of what is on the seafloor. The only drawback of side-scan sonar technology is that the depth of these obstructions cannot be ascertained. Determining the depth of an obstruction is where multi-beam sonar is applied.  Multi-beam sonar utilizes fan-shaped sonar that records depths.  This is done by recording the time it takes for the acoustic signal to travel from the receiver to the seafloor (or object on the seafloor) back to the receiver. The receiver is often referred to as a transducer. The multi-beam sonar transducer is attached underneath the launch.  The combination of side scan sonar and multi-beam sonar create for specific data that can be shared so that navigable waters are safe.

Personal Log: “I have my sea legs!” 

I must admit I was a bit nervous about being seasick!  Our thirty-hour journey was difficult for me for only about three hours, right at the beginning of the trip.  I am very happy for a short experience with seasickness! After getting my sea legs, it is interesting to realize that one can adapt quickly. Often I felt like I was being rocked to sleep as we made our way to our destination through the waves of the ocean. After being on a ship for a couple of days, experiencing land is an interesting sensation. I missed moving around on water and felt as if I were on water even though I was on land! I do not really miss being on land at all.

NOAA Teacher at Sea, Candice Autry, enjoys pudding while taking a break from observing data collection using side-scan sonar. The Statue of Liberty is in the background!
Candice Autry, enjoys pudding while taking a break from observing data collection. The Statue of Liberty is in the background!

Candice Autry, August 7-12, 2006

NOAA Teacher at Sea
Candice Autry
Onboard NOAA Ship Thomas Jefferson
August 7 – 18, 2006

Mission: Hydrographic Survey
Geographical Area: Northwest Atlantic
Date: August 7 -12, 2006

“Ships have many pieces of complicated equipment!” 

The NOAA Ship THOMAS JEFFERSON awaits a necessary part for the crane that lifts the fast rescue boat, then we set sail
The NOAA Ship THOMAS JEFFERSON awaits a part for the crane that lifts the fast rescue boat, then we set sail

Personal Log 

Hello, greetings from Teacher at Sea Candice Autry.  I teach science to middle school students at a wonderful school called Sheridan School in Washington, DC.  I have been given the great opportunity to sail with the crew on the NOAA Ship THOMAS JEFFERSON. Our cruise has been delayed several days due to unforeseen problems with some of the complex and necessary equipment on the ship.  It is important to be flexible with any kind of change, so these past few days have given me the opportunity to explore the ship as we wait for final repairs. The objectives of this particular ship primarily involve hydrographic surveys.  Hydrography is the science that has to do with measuring and describing physical characteristics of bodies of water and the shore areas close to land. Thanks to hydrographic surveys, ships, ferries, pleasure boats, and other vessels can safely navigate in busy waters without hitting any obstructions on the bottom of a harbor.

A functioning crane on the NOAA Ship THOMAS JEFFERSON lifts the necessary fast rescue boat (FRB) aboard.
A crane lifts the necessary fast rescue boat aboard.

Hydrographic surveys can also locate submerged wrecks in deep waters; examples include unfortunate events such as shipwrecks out at sea as well as plane crashes over the ocean. These surveys are done by using technology that involves side scan sonar and multi-beam sonar technology. The combination of these two types of technologies can create a clear picture of a barrier on the ocean floor and the depth of the obstruction.

The THOMAS JEFFERSON holds several smaller boats including two launches (one launch is visible in the picture, it is the gray boat) that have this sonar technology located underneath the vessel. The instrument that collects data is often called a “fish.”  The data can be seen on a computer screen so that the surveyors can view the data being collected.  Once we reach our destination, we will use these launches, one equipped with a fish that uses multi-beam sonar technology and the other with a fish that uses side scan sonar to create a chart of what is on the bottom of a very busy harbor!

Seaman Surveyors Doug Wood and Peter Lewit interpret hydrographic data in the survey room
Staterooms are comfortable and cozy!
One of the workrooms aboard the NOAA Ship THOMAS JEFFERSON.
 A closer look at the navigational equipment on the bridge
A closer look at the navigational equipment on the bridge