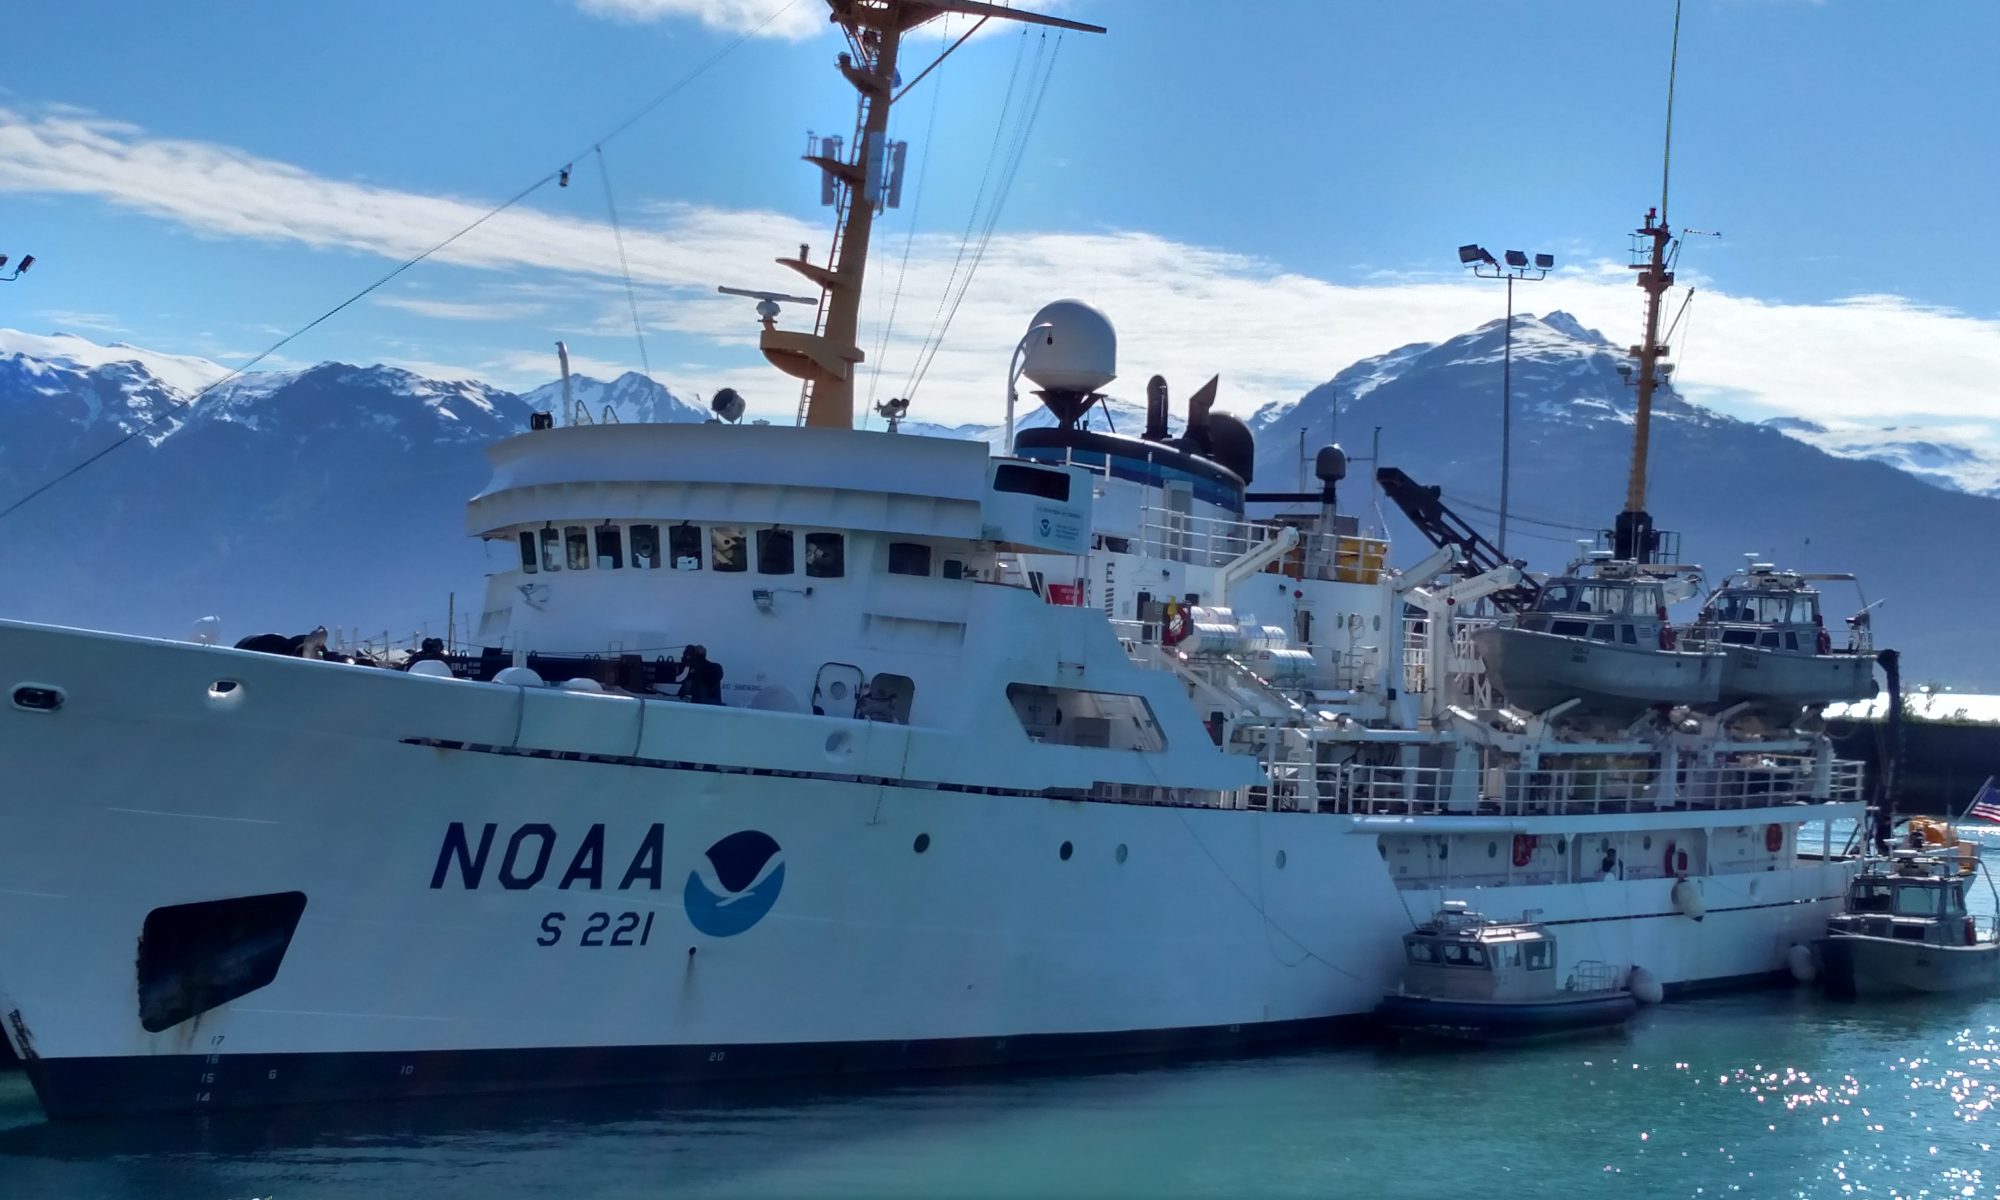
NOAA Teacher at Sea Cassie Kautzer Aboard NOAA Ship Rainier August 16 – September 5, 2014
Mission: Hydrographic Survey Geographical Area of Survey: Woody Island Channel, Kodiak, Alaska Date: August 22, 2014
Temperature & Weather: 11.5° C (53° F), Cloudy, Rainy
Science & Technology Log
Today was ‘Day 4’ of surveying in the Woody Island Channel next to Kodiak, Alaska. The Woody Island Channel is a very busy waterway leading ships, boats, and vessels of all sizes into Kodiak. The problem at the moment is that much of the Woody Island Channel has shoals (shallow areas) and rocks. This can be very dangerous, especially since the channel has not been surveyed or mapped since the 1940’s! At that, in the 40s, surveyors were using Lead Lines to map the ocean floor. Lead Lines were long ropes, marked with measurements, and with a weight at the end, that were thrown out to measure the depth of the water. Lead Lines were considered very accurate for their time. The problem with Lead Lines is that there was no way for surveyors to map the entire ocean floor–the lead line only gave a measurement of depth in one location (point) at a time.
Drawing of Lead Line Survey, formerly used to survey water depths one point at a time.
Today, NOAA Hydrographers use Multibeam Echosounders. A Multibeam Echosounder uses sonar to send out hundreds of sound pulses and measures how long it takes for those pulses to come back. The multibeam echosounder is attached to the hull, or bottom, of the survey launches. To find out how deep the ocean floor is in an area, depths are generated by measuring how much time it takes for each of hundreds of sound pulses to be sent out from the echosounder, through the water to the ocean floor and back again. The sound pulses are sent out from the echosounder in an array almost like that of a flashlight.
Image shows swath of echosounding from the hull of the launch. Different colors represent different depths. (Courtesy of NOAA)
The deeper the water, the wider the swath (band of sound pulses). The more shoal (shallow) the water, the smaller the swath. Basically, a wider area can be surveyed when the water is deeper. This means that surveying near shore, near rocky areas, and near harbors can be very time consuming. These surveys do need to be completed, however, if they are in navigationally significant areas, like the Woody Island Channel that Rainier is surveying right now.
Image of hydrographic survey methods as they’ve changed over time.
Technological advances over the years have made it more efficient and more accurate to survey the oceans.
Using multibeam sonar, the Rainier has surveyed thousands of linear nautical miles of ocean in the past couple of years. In 2012 the Rainier was away from its home port in Newport, Oregon for 179 days–surveying 605 square nautical miles and 9,040 liner nautical miles. In 2013 Rainier was away from its home port for 169 days – surveying 640 square nautical miles and 7,400 linear nautical miles. It is NOAA’s goal to get 10,000 linear nautical miles surveyed each field season between all four of its Hydro ships: Rainier, Fairweather, Thomas Jefferson, and Ferdinand R. Hassler. Several years, the Rainier has come close to this on its own!
Personal Log
I have spent the last four days out on the survey launches, gathering data, with a bunch of amazing people. I have had the opportunity to drive a launch several times, with skilled Coxwain and Able Seaman Jeff Mays supervising me and helping me adjust to the differences in driving/steering a heavy boat versus driving my car at home. Jeff always took back over when we got to a rocky area or area that was shoaling up quickly. I am grateful to him, however, for the opportunity. As with any skill that needs to be practiced, I got a little better each time I drove. (Trying to steer in a straight line/path on the water when dealing with wind, water currents, waves, wakes from other boats, and the boats themselves is tough! At least for me. Coxwains Dennis Brooks and Jeff Mays make it look easy, and always kept me feeling safe aboard the launch boats!)
Me, at the wheel of a survey launch. (Photo courtesy of HSST Barry Jackson )
For My Students
Below is an update on my Alaskan Wildlife sightings. Remember, these are all animals I have been within 20 feet of (except for the bear). Along with the wildlife in the graph below, I have also seen hundreds of birds from a distance and several romp of otter (large groups).
Wildlife I have seen thus far, graphed using Create A Graph (nces.ed.gov/nceskids/createagraph)
Can you help me identify the pictures below? It can be quite difficult to identify creatures and “stuff” in the dark ocean waters.
NOAA Teacher at Sea Cassie Kautzer (Almost) Aboard NOAA Ship Rainier August 16 – September 5, 2014
Mission: Hydrographic Survey Geographical area of cruise: Cold Bay, Alaska Date: August 11, 2014
Personal Log
Hi! My name is Cassie Kautzer and I am writing to you from my couch in Northwest Arkansas. I am hiding inside with the air conditioning today because my thermometer shows it being 95 degrees Fahrenheit, and that is too hot for this former Wisconsin girl! I am finishing packing and doing some final research before I head to Alaska on August 16! (I am also very much looking forward to cooler temperatures!)
Alaska or Bust! This science girl is ready!
I am a fifth grade teacher at Monitor Elementary in Springdale, Arkansas! I have loved MONITOR and all my little Mallards since 2008 when I had the honor of joining the Monitor Team. Monitor Elementary houses a very diverse population of around 800 students each year. This school year, I will have the pleasure of teaching science to 112 of those students, and I cannot wait to share this amazing experience with them! Since Arkansas is not a coastal state, neither my students nor I have a lot of experience with marine ecology or tidal influences. In the Paleozoic Era, however, the entire state was covered by relatively shallow ocean, the Ouachita Basin.
I applied for this wonderful learning opportunity for several reasons:
• I am like my students, I learn by DOING! I can’t take all of my students with me (though I would if I could), so I will learn and gather new information, first hand, and take back pictures, videos, stories, lessons, and activities to share with them!
• I want my students to see the bigger picture–how is our life in Arkansas affected by oceans, tides, floods, erosion?
• I want my students to see the scientific opportunities, jobs, and careers that are available to them! I want to help inspire future scientists!
• I want my girls to see women working in scientific fields!
• And… I love adventure, and exploring and learning about our beautiful world! I will not fear the unknown; I will learn and grow as I figure it out!
On top of the world! I made my first visit to Whitaker Point in Arkansas this summer!
My mission this summer, from August 16 – September 5, will be a Hydrographic Survey aboard the NOAA Ship Rainier. NOAA is the National Oceanic and Atmospheric Administration. NOAA’s mission is to understand the Earth’s environment in order to conserve and care for marine (ocean) resources. The Rainier is “one of the most modern and productive survey platforms of its type in the world” and uses multibeam sonar systems to “cover large survey areas in a field season. The ship’s hydrographers acquire and process massive amounts of data and create high-resolution, three-dimensional terrain models of the ocean floor.” Those models can then be used to identify obstructions and shoals along the bottom of the ocean that are dangerous for navigating ships. (http://www.omao.noaa.gov/publications/ra_flier.pdf) Hydro ships, like the Rainier, map the ocean floor to help with safe navigation of the seas. Knowing the depth and make-up of the ocean floor surrounding Alaska will benefit all the vessels and ships, large and small, passing through the Gulf of Alaska. Activities onboard can include echosounding, tide gauge installation, shoreline surveying, verification, and mapping, and data processing.
NOAA ship Rainier, named for Mt. Rainier – a volcanic cone in Washington state that rises 14,410 feet above sea level. Photo courtesy of NOAA.
So what does all of that mean?? I am about to find out! NOAA’s Teacher at Sea program aims to provide me, the teacher, with real-world research experience through work with world-renowned scientists, to allow unique insights into oceanic and atmospheric research crucial to our world. To this end, I truly believe the best way to learn is by getting ones hands dirty and trying to figure things out. So, on August 16 I will head to Alaska and meet up the Rainier in Kodiak, AK. On August 18 we will depart from Kodiak and head toward Cold Bay to begin our hydrographic survey mission.
Right now, I have more questions than answers: What will it be like without land beneath my feet for three whole weeks? What hours will I work? How am I going to learn all the crew members’ names? Will I get sea sick? What is echosounding? Will I get to go out on a launch? What marine life am I going to see? Will I ever want to leave Alaska? I guess I am about to find out!
For My Students
Can you find out…..?
1. How can I track the distance and speed I am traveling at while on the Rainier? (What units would I use to measure and share this information with you?)
2. When I am on the Rainier, weather information will be shared in degrees Celsius. How can I convert that information to degrees Farenheit so all of my non-science friends can understand?
“Leave a Reply” at the very bottom of this page! I am looking forward to answering (or trying to answer) your questions and sharing this epic learning adventure with you!
And of course, as Will.I.Am wrote and sang, and I kareoked to my students all year, “Reach for the Stars” and you’re sure to end up in the “Hall of Fame!”
Geographic area of the cruise: Atlantic Ocean, off the coast of North Carolina and South Carolina
Date: July 13, 2014
Weather Information from the Bridge
Air Temperature: 27.6 °C
Relative Humidity: 73%
Wind Speed: 5.04 knots
Science and Technology Log
Someone is always working on the Pisces. When Nate Bacheler and the other fishery scientists have finished their work for the day collecting fish, it is show time for the hydrographers, the scientists who map and study the ocean floor. Their job is to map the ocean floor to help Nate find the best places to find fish for the next day. Warren, Laura, David and Matt were kind enough to let me join them and explained how they map the ocean floor while on board the Pisces.
People have learned over the years that some fish like to hang out where there is a hard bottom, not a sandy bottom. These hard bottom areas are where coral and sponges can grow and it also happens to be where we usually find the most fish.
Instead of using a camera to find these hard bottom habitats, the mapping scientists use multibeam sonar. Here is a simple explanation on how sonar works. The ship sends a sound wave to the bottom of the ocean. When the sound wave hits the bottom, the sound bounces back up to the ship.
Since scientists know how fast sound travels in water, they can figure out how far it is to the ocean floor. If the sound wave bounces back quickly, we are close to the ocean floor. If the sound wave takes longer, the ocean floor is farther away. They can use this data to make a map of what the ocean floor looks like beneath the ship.
The neat thing about the Pisces is that it does not send down one sound wave only. It sends 70 waves at once. This is called multibeam sonar.
Single Beam versus Multibeam sonar. Can you see why hydrographers like to use multibeam sonar? Credit: NOAA
So, now you know how sonar works in simple terms.
But it gets a little more complicated. Did you know that sound speed can be affected by the water temperature, by how salty the water is (the “salinity”), by tides, and by the motion of the ship? Computers make corrections for all of these factors to help get a better picture of the ocean floor. But, computers don’t know the physical properties of our part of the ocean (because these properties change all the time) so we need to find this information and give it to the computer.
To find the temperature of the ocean water, the mapping scientists launch an “XBT” into the water. XBT stands for “expendable bathythermograph.” The XBT records the changes in water temperature as it travels to the ocean floor. It looks like a missile. It gets put into a launcher and it has a firing pin. It sounds pretty dangerous, doesn’t it! I was excited to be able to fire it into the water. But, when I pulled out the firing pin, the XBT just gently slid out of the launcher, softly plopped into the ocean, and quietly collected data all the way to the ocean floor.
Kevin McMahon nervously holding the XBT Launcher and waiting for the order to fire.
Kevin McMahon watches as the XBT gently plops out of the launcher.
With the new data on water temperature, the hydrographers were able to create this map of the ocean floor.
Example of an Ocean Floor Map
In the map above, blue indicates that part of the ocean floor that is the deepest. The green color indicates the part of the map that is the next deepest. The red indicates the area that is most shallow.
Nate talks to the hydrographers early in the morning and then predicts where the hard bottom habitats might be. In particular, Nate looks for areas that have a sudden change in elevation, indicating a ledge feature. If you had Nate’s job, where would you drop the 6 traps to find the most fish? Look at the map below to see where Nate decided to deploy the traps.
The green dots are the spots where Nate dropped the traps in hopes of finding fish.
To find out more about using sound to see the ocean floor and to see an animation of how this works, click on this link:
We have now gotten into a regular routine on the ship. The best part of the day for me is when we are retrieving the traps. We never know what we will see. Sometimes we catch nothing. Sometimes we find some really amazing things.
Here are a few of my favorites:
Closer view of sharksucker on my arm
Somebody is crabby.
Sea stars with beautiful navy blue colors
A pair of butterflyfish
Did you know?
The ocean is largely unexplored. Maybe someday you will discover something new about the ocean!
Mission: South Atlantic Marine Protected Area Survey
Geographical area of cruise: South Atlantic
Date: June 20, 2014
Weather: Sunny with clouds. 26.6 Celsius. Wind 13 knots from 251 degrees (west). 1-2m seas from the north.
** Note: Upon request, note that if you click on any picture it should open full screen so you can the detail much better!
Science and Technology Log
Research mission objectives – what am I doing out here?
Gathering data on habitat and fish assemblages of seven species of grouper and tilefish in the South Atlantic MPAs . These species are considered to be at risk due to current stock levels and life history characteristics which make them vulnerable to overfishing. Information gathered will help assess the health of the MPAs, the impact management is having, and the effectiveness of ROV exploratoration to make these health assessments.
Science Part I: Multibeam sea floor mapping Multibeam sonar sensors — sometimes called multibeam acoustic sensorsecho-sounders (MB for short) are a type of sound transmitting and receiving system that couple with GPS to produce high-resolution maps of the sea floor bottom. See how it works by checking out this cool NOAA animation. MB mapping is occurring all night long on the Nancy Foster by a team of expert mappers including Kayla Johnson, Freidrich Knuth, Samantha Martin, and Nick Mitchell (more on them and their work and NOAA careers in a future blog). Our Chief Scientist Stacey Harter has identified areas to map.
OK, so we aren’t exactly MB mapping in this photo but I wanted to introduce everyone to my host Chief Scientist Stacey Harter in one of my first pictures.
By morning, after the mappers have worked their magic on the data, Stacey is able to see a visual representation of the sea floor. She is looking for specific characteristics including a hard sea floor bottom, relief, and ridge lines – important characteristics for the groupers, tilefish, hinds, and other fish species under protection and management. Stacey uses these maps to determine transects for ROV exploration. Those transect lines are used by both the scientists driving the ROV and the navigation crew aboard the Nancy Foster. Once down on the ocean floor, the ROV pilot follows this transect and so must the ship high above it in the waves driven by the crew. Although 3 floors apart – it’s amazing to hear the necessary communication between them. (Watch for one of my future posts that will highlight a MB map and a sample transect line.)
Science Part II: ROV exploration – Completion of 8 dives
By the time this posts, we will have made 8 dives with the SubAtlantic Mohawk 18 ROV from University of North Carolina. (perhaps we will have made more dives because internet via satellites is slow and I am uncertain when this will really get posted.)
JB and ROVs first date aboard the aft deck on the Nancy Foster
The ROV joined the mission with its two pilots, Lance Horn and Jason White. Pilots extraordinaire but I otherwise see them as the ROV’s parents guiding and caring for its every move. The technology aboard the ROV is incredible including a full spectrum video camera, a digital camera, sensors to measure depth and temperature, and 4 horizontal thrusters and one vertical thruster with twin propellers. The ROV has donned a pair of lasers which when projected on the sea floor allow the scientists to measure items.
JB attaching the CTD probe to the ROV with instructions from Steve Matthews.John receiving ROV deployment instructions from Andy David; including about how the cable attaches to the ROV and the fiber optic line.
ROV deployment
The ROV control station is daunting! As one may imagine, it does include three joysticks accompanied by multiple switches, buttons, lights and alarms – all just a fingertip away from the ROV pilot. Five monitors surround the pilot – some of them are touch screen activated adding more to the selection of options at their fingertips. Is a Play Station a part of your daily routine? Perhaps you should consider a career at NOAA as a ROV pilot!
ROV operations station. 1. Power supply, 2. Joystick controllers, 3. Multiple switches, 4. Four monitors for the ROV pilot alone, 5. Two monitors for the video and digital picture technician, 6. Laptop controlling digital pictures, and 7. Multiple DVD recorders.
While the ROV drives and explores a set transect line, six additional scientists and assistants identify and record habitat, fish species, invertebrates, and other items that come into vision on any one of the monitors scattered around the lab located inside the ship. Two scientists are recording fish species and a scientist accompanied by me the past two days are identifying habitat and invertebrates.
John assisting Stephanie Farrington (not pictured) with habitat and invertebrate identification and logging.
Of course, the ROV is on the move constantly, so fish and items of interest are flying by – you don’t have time to type or write so the scientists use short cut keyboards pre-coded with species and habitat descriptors. Meanwhile another scientist is narrating the entire dive as everything is being recorded and yet another is controlling DVD video recording and centering and zooming the digital camera capturing hundreds of pictures during a dive. You would be surprised by the number of computers running for this operation! What is amazing is that everything will be linked together through a georeferrenced database using latitude and longitude coordinates.
Science Part III. What have we seen and discovered?
On June 19th & 20th we completed 8 dives. Some of the first species we saw included the shortbigeye, triggerfish, reef butterflyfish, and hogfish (Here is a good link of fish species on the reefs located here.) We also observed a few stingrays and speckled hind. For invertebrates, we saw a lot of Stichopathes (tagged as dominate during the dives) and fields of Pennatulacea (long white feathers). We also saw echinoderms and solitary cap coral (a singular, white tube coral) and discovered a Demospongiae that Stephanie, one of the Research Biologists (see below) hadn’t seen yet; we called it a bubble-wrap sponge in my hand-written notes.
Things that we saw today that we wished we hadn’t seen:
Pollution So with much of my teaching centered around clean water and pollution prevention and mitigation, I was saddened to discover the following items on the ocean floor during the first five dives: Plastic bags, cans, a barrel, a clearly visible rubber surgical glove, and an artillery shell. Interesting – from the ROV you can easily spot what the scientists call ‘human debris’ as it often has straight lines and corners, distinctly human crafted shapes – not like mother nature engineers.
Plastic balloon found during dive #2 at about 60 meters. Photo credit: NOAA UNCW. Mohawk ROV June 2014.Black plastic garbage bag found at about 60 meters. NOAA UNCW. Mohawk ROV June 2014.
Career highlight: Stephanie Farrington, Biological Research Specialist
Harbor Branch Oceanographic Institution at Florida Atlantic University
Masters of Science in Marine Biology. Bachelors of Science in Marine Science and Biology.
Stephanie’s expertise is in collecting, classifying, and mapping marine biology with emphasis in habitats and invertebrates. She is also proficient in ArcGIS for mapping and maintaining a database of everything she sees, discovers, and observes. During this research trip, she is the scientist charged with identifying the habitat with an emphasis on the invertebrate species that speckle the sea floor. For the past two days I have shadowed her side – watching the video feed from the ROV and logging. She is a wealth of information and I really appreciate sitting next to her the past two days. She is a master in biology and a master in buttons – and a fun spirit too.
Personal Log
Day 2 was spent almost entirely in transit – getting north from Mayport to Georgia, almost 9 hours. Part of that time was spent getting to know the research team and participating in safety drills. Sorry everyone; I did not get a picture of me in my red gumby suit (aka the life saving immersion suit). Upon recommendation from a colleague (you know who you are) I also spent two hours on a bench on the bow reading The Big Thirst by Charles Fishman
“If Earth were the size of a Honda Odyssey minivan, the amount of water on the planet would be in a single half-liter bottle of Poland Spring in one of the van’s thirteen cup holders.”
Although I have been out on the ocean before as well as the Great Lakes, on this day I simply felt tiny in a vast sea of blue.
For those who know me during my off-work hours, I also hit the ship’s gym -yes, that’s right, I am keeping up my routine with one exception. My Paleo diet is now nearly broken – too much great food here from the ship’s chef’s, including ice cream.
Last night, at the end of Day 3 (Thursday) I spent the evening on the beach! Well actually, what they call steal beach – a platform aft (behind) the ship’s bridge equipped with lounge recliners to watch the sunsets. I sat up for seemingly hours trying to write all my excitements and discoveries in a log I am keeping. Don’t worry though, I won’t make you read it all; my blog readers will only see a small snapshot of all I have been seeing and discovering!
Glossary to Enhance Your Mind
Each of my logs is going to have a list of new vocabulary to enhance your knowledge. I am not going to post the definitions; that might be a future student assignment. NOAA’s Coral Reef Watch has a great site of definitions HERE.
NOAA Teacher at Sea Beverly Owens Aboard NOAA Ship Henry B. Bigelow June 10 – 24, 2013
Mission: Deep-Sea Corals and Benthic Habitat: Ground-Truthing and Exploration in Deepwater Canyons off the Northeastern Coast of the U.S. Geographical Area: Western North Atlantic Date: June 13, 2013
Weather Data from the Bridge:
Air temperature: 16.70 oC (62.06 oF)
Wind Speed: 25.17 knots (28.96mph)
Science and Technology Log
Waypoints for TowCam expedition
“You get to go on a two-week cruise for vacation!”
This is the misconception that some people had, when I told them initially that I would be participating as a NOAA Teacher at Sea. On a vacation cruise and a research cruise, participants stay an extended period of time on the ocean, and they receive three meals a day. That is pretty much the end of the similarities between these types of cruises. During a scientific research expedition, there is a mission to accomplish. For example, this trip is examining sites that are known or predicted to be deep-sea coral and sponge habitats.
Many multibeam bathymetric maps are consulted to find the most suitable sites to investigate. Bathymetric maps are similar to topographic maps with the exception that bathymetry applies to the topography of the ocean floor. Most of the major structure-forming deep-sea corals are found on hard substrate. Thus, areas of soft sediment are not the most likely places to find the majority of coral species, however many other organisms like brittle stars and anemones, may be found there.
There is a lot of preparation that goes into planning and coordinating a research “cruise.” The Chief Scientist must put in a request for a research vessel, and must assemble a science crew that has the skills and research interests that align with the research mission. In the months leading up to the research trip, the science party will discuss specific science objectives, protocols and potential study sites. Every participant must receive medical clearance, which includes having a TB (tuberculosis) test, and a recent tetanus vaccination.
The Chief Scientist, with input from the science team, determines which areas of the ocean to examine, and what type of technology to use to explore the ocean. Weather and waves may prevent some of the “dives” from taking place. Safety first – the conditions must be safe enough for the TowCam operators and deck crew to be outside during deployment as they lower TowCam safely into the ocean.
This bathymetric map displays the topography of the ocean floor.
During TowCam deployments, many things must be done to make the dive successful. The Chief Scientist selects several points (waypoints) along a survey line within a canyon. These points help guide the ship during the TowCam deployment. To get TowCam into the water requires a lot of communication and coordination of efforts. The winch operator and deck crew are responsible for getting TowCam into the water. The winch operator is in constant contact with the TowCam pilot and controls the wire that lowers TowCam into the water. At a certain depth, the control is passed to the TowCam pilot in the lab who uses a joystick to lower the camera to the ocean floor. The pilot and the Bridge are in constant communication during the dive. The Bridge controls the ship and follows the track for the survey. The TowCam pilot analyzes data displayed on several computer monitors in order to make the most informed decisions as they guide the camera through the water column by moving TowCam and up and down in the water column. In addition, a variety of data are collected during the deployment. I have been logging data during the night shift deployments. I help keep track of variables such as depth, winch wire tension, latitude, longitude, and altimeter readings along the survey track. All this information will be invaluable to scientists examining the data collected during this research cruise.
Personal Log
At Crest Middle School, we try to teach our students critical thinking skills: think for themselves, make informed decisions, gather data, predict, and draw conclusions. This research trip is a prime example of how skills that students acquire in school will be beneficial for them in the future. When completing a task such as logging data, I have to decide what the important events are that have occurred in the TowCam dive, and to phrase those items in a way that others will understand.
TAS Beverly Owens logging data
Did You Know?
TowCam is about the size of a refrigerator. It has one large high-resolution camera that takes pictures every 10 seconds. It also has a CTD, which records conductivity (salinity), temperature, and depth. TowCam also carries several Niskin bottles, used for water collection at depth and a slurp pump that pulls sediment from the ocean floor into a container for later analyses.