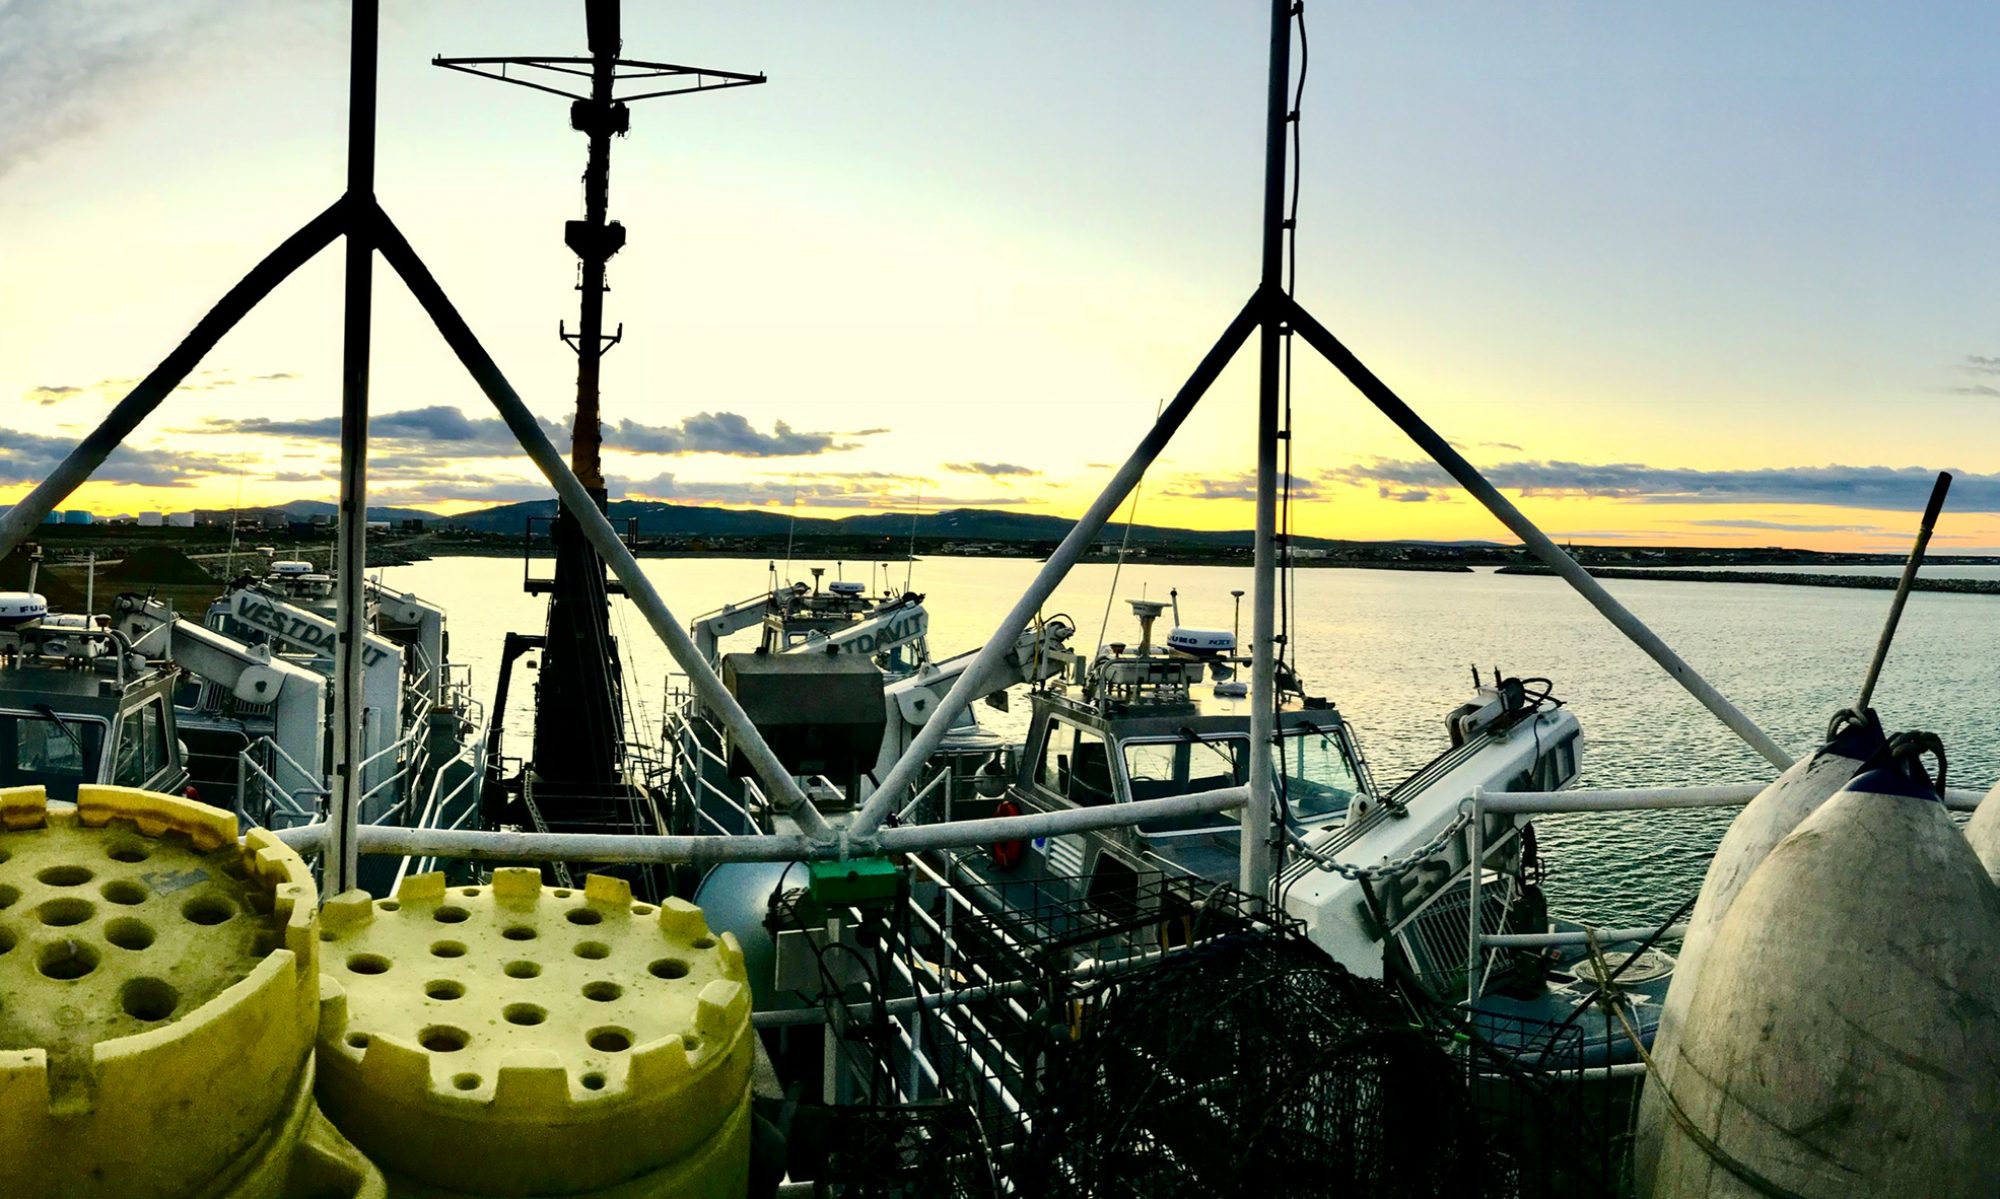
Chris Harvey, June 6, 2006

NOAA Teacher at Sea
Chris Harvey
Onboard NOAA Ship Oscar Elton Sette
June 5 – July 4, 2006

Mission: Ecosystem Survey
Geographical Area: Central Pacific Ocean, Hawaii
Date: June 6, 2006

Science and Technology Log 

I survived the night with ease! The only problem I had was after I woke up the first time (around 1:30 AM) and could not fully get back to sleep.  I am still struggling with this jetlag thing, although my “sea legs” are coming along well.  Knock on wood; I am already well adjusted in the inner ear, though I still get tossed around a bit when I try to walk. I can handle that though. It is the seasickness that I feared.

I ate breakfast with Amee and John, the Electronics Technician guy.  He handles all of the communications and electronics stuff on the ship.  We all traded past war stories and somehow ended up in a pseudo-philosophical discussion about science and technology and the future of our world. (I say “pseudo-philosophical” because none of us is trained in any way in philosophy!) Yeah, we are all science geeks!  But it was fun. I am learning that everyone on the ship is very kindhearted and friendly.  I guess you have to be if you are going to live in such close quarters together for so long.  I’ve begun to think of this ship in terms of reality shows (Not that I am a fan of them, but we are under a lot of the same conditions: many strangers with unique backgrounds put together in a strange situation, forced to share resources in close conditions, while attempting to complete a task or mission in a given amount of time.).  I will attempt to document the human element of this trip as much as the scientific.  After all, is observation not a key element to the scientific method?  So far we are drama-free, aside from losing Tonatiuh.  But there are still 30 days left.

On a more concrete note, we are headed towards Necker Island, to the northwest of Oahu.  Unofficial word is that we will be there by mid-afternoon.  Although I have also heard that we have another full day of transit.  When we arrive there, we will begin baiting and setting lobster traps. Our mission on the OSCAR ELTON SETTE is to trap lobster in the Hawaiian waters, take measurements of tagged lobsters, and keep track of the overall population density of lobsters in the given areas.  My colleagues are concerned that the number of lobsters in the area is remaining low despite the fact that the waters have been off limits to commercial fishermen since 1990.  They are hoping that, each time they come out here, there will be a sudden increase in the number of lobsters in the area.  Something must be keeping the population down, and through the data we collect, we will be able to contribute to determining the cause, and therefore be able to help scientists devise solutions to stabilizing the lobster population.

Until we reach Necker Island, it is smooth sailing across a gently rolling Pacific, upon my perch on the Marine Mammal Observation Deck, the highest deck set directly above the bridge and which is intended for use for scientists to search for whales, dolphins, and other such life. It is covered, with a nice breeze, and Garret, a fellow researcher, is playing his harmonica.  Life couldn’t get much better.

On that note: Bob, the Chief Scientist onboard the ship (my “boss” so to speak) has made it rather clear to me that when the time to work comes, I will be working hard alongside everyone else. “I don’t know what they told you about the Teacher at Sea program,” he told me over the phone when I first arrived in Honolulu.  “But you are not going to be just observing. You will be getting hands on and dirty.”  “Good,” I told him with a smile on my face.  “That’s why I am here.”  I imagine that when we arrive at Necker Island the pace of life will pick up rather dramatically.  Until then, I am going to work on learning the ropes and enjoy my time with good company.

We have stopped the ship so that we can take a CTD reading.  The CTD reading is a measure of Conductivity, Temperature, and Depth of a water sample between the surface and 500 meters below the surface.  I was very interested in this because 1) it is the first time we have stopped the ship since we made our run out of Honolulu and a change of scenery is great when you are on a ship; and 2) the information that comes back from a CTD is very relevant to the information that I cover in my Earth/Space Science class (Mother, you will have to find some answers to questions I will pose, since some of the data contradicted my thoughts of what it should be.)

The data we are collecting is part of a time series, meaning that we are taking the sample at a specific point that has been sampled in the past and will be sampled in the future.  Scientists can then use the data over time to make inferences about such things as an approaching El Nino or La Nina, suitable regions for supporting animal populations, and other such conclusions based on our basic oceanographic data.  In addition to temperature and depth, the CTD measures the amount of oxygen and chlorophyll in the water, as well as the ocean’s salinity. Why is this data important?  We’ll get to that in a minute.

The CTD is nothing more than a weighted contraption with sensors built into it.  It is picked up by a winch and then released at a rate of 60 meters per minute to a maximum depth of 500 meters.  For this trip, we are going to take four CTD readings.  It is a secondary mission for us, meaning the only reason we are doing it is because we happen to be in the area. As the CTD increases in depth, these are some things I would have expected to see:

1) Temperature should decrease (the deeper it goes, the further it is from sunlight)

2) Chlorophyll count should decrease (Chlorophyll is dependent upon sunlight as well. This is the same chlorophyll that is found in green plants on the solid earth, and is important because it is the most basic form of life for the aquatic food chain. Thus, the more chlorophyll, the greater the chance that an aquatic food chain could be established and supported in a given region of water.  No chlorophyll would indicate a region of water that would most likely not be able to sustain life- i.e.- without chlorophyll there would be no plankton.)

3) Salinity should increase (Saline water is more dense than fresh water, so more saline water should be found at greater depths than less saline water)

4) Oxygen should be found in greatest abundance wherever chlorophyll is in greatest abundance. (Remember from Biology 101, chlorophyll takes carbon dioxide and sunlight and converts it to oxygen)

What actually happened was this:

1) Temperature did in fact decrease with depth, though only slightly.  We were at a depth of over 4,000 meters and we only sent the CTD down 500 meters.  Imagine what would have happened if we sent it down further!

2) The chlorophyll count went from about zero to its maximum at 100 meters, and then returned back to zero by 200 meters depth. This makes sense since most of the sunlight is absorbed by 200 meters.

3) The salinity of the seawater increased at first, then decreased, and ultimately ended up about the same as at the surface.  This is the question I pose for you Terry (ask Marge for some assistance!): Why?  One of my colleagues, smartalec Amee, told me that it was because the Coriolis effect was stirring the ocean between depths of 0-500 meters.  Is this true?  (Remember, Amee is British so I must second-guess ANYTHING and EVERYTHING she says!)

4) Oxygen followed the same suit as I suspected and was at greatest concentration where the chlorophyll was at greatest concentration.

It was very interesting to conduct this investigation because the data that I use in class comes from surveys such as ours.  This was another exciting science-geek moment for me because I seem to forget quite often that I am on a NOAA research vessel conducting the research and acquiring the data that many science resources across the world become dependent upon!

On the sociology side of things, our reality show would never cut it back in the States.  It seems that we all just get along too darn well!  No matter what we seem to say or do to each other, everything seems to come out positive.  Imagine having classrooms with environments like this!  Imagine communities cooperating like we do!  Imagine entire cities or states or countries, or God-forbid, the entire world!  The words of John Lennon come to mind: “…Imagine all the people…”  I guess I am in a utopia of sorts, where life is different only for the time being.  But just imagine!

…you may say that I’m a Dreamer, but I’m not the only one…

Joan Raybourn, August 24, 2005

NOAA Teacher at Sea
Joan Raybourn
Onboard NOAA Ship Albatross IV
August 14 – 25, 2005

Mission: Ecosystem Productivity Survey
Geographical Area: Northeast U.S.
Date: August 24, 2005

Weather Data from the Bridge

Latitude: 43°32’ N
Longitude: 69°55 W
Visibility: 8 miles
Air Temperature: 17° C
Wind direction: E (99 degrees)
Wind speed: 5 knots
Sea wave height: 1’
Sea swell height: <1’
Sea water temperature: 18.8°C
Sea level pressure: 1018.0 millibars
Cloud cover: 7/8 Cumulus

Question of the Day: At what degrees on the compass would you find the intermediate directions? (Use information below to help you and look for the answer at the end of today’s log.

Yesterday’s Answer: GMT stands for “Greenwich Mean Time”. GMT is the time at the Prime Meridian, which passes through Greenwich, England. People around the world can use this time as an international reference point for local time. We are on Eastern Daylight Time (EDT), which is four hours behind GMT. At 1:33 a.m. GMT, it was already August 24 in Greenwich, but our local time was 9:33 p.m. EDT, still August 23, so that is the date I used in the log.

13

Science and Technology Log

Over the last eleven days, the ALBATROSS IV has zigzagged back and forth across southern New England waters, Georges Bank, and the Gulf of Maine. The collection stations were chosen in advance of the trip and plotted on an electronic chart. So how does the crew drive the boat to the next station?

Ship navigation is a combination of automated and manual tasks. Based on the ship’s current position and the latitude and longitude of the next station, the navigator determines what heading to take. That is, he decides in exactly which direction to go using a compass. The ship has an electronic gyroscope as well as a manual compass similar to the ones you may have seen, only larger. It has a magnetic needle that points north, and is divided into 360 degrees. The cardinal directions are these: 0° is north, 90° is east, 180° is south, and 270° is west. The navigator enters the heading into the ship’s navigation computer, and if conditions are normal, he can set the ship on Autopilot. Then the computer will automatically adjust the ship’s direction to keep it on course.

The fact that the ship is running on Autopilot does not mean that the crew can take a break. The crew sets the ship’s speed depending on weather and sea conditions, and on how much other ship traffic there is in the area. In open water, the ALBATROSS IV cruises at about ten to twelve knots, which means we cover about 10 to 12 nautical miles per hour. The crew must constantly monitor to make sure the ship is operating safely and efficiently. They plot the ship’s course on paper, monitor weather conditions, watch for other ships and communicate with them, and adjust the ship’s course and speed. At the collection stations, they are able to put the ship at the exact latitude and longitude called for, and keep it there during water casts and sediment grabs, or moving at just the right speed for plankton tows.

Navigators keep a constant watch out for other ships, using a combination of visual and radar data. They use radar to pinpoint the ships’ locations, and often can be seen scanning the sea with binoculars. Signal lights on ships help with navigation, too. Ships have a red light on the port (left) side and a green light on the starboard (right) side. This helps navigators know which side of a ship is facing them and in which direction it is headed. Of course, radio communication makes it possible for ships’ crews to talk to each other and make sure they are passing safely.

Personal Log

Tonight will be the last night of the cruise. We expect to be back in Woods Hole by midday tomorrow, two days earlier than planned. We’ve been blessed with excellent weather, and have made good time cruising between stations. I was very excited last night to see fireworks in the toilet! Toilets on the ship are flushed with sea water, which often contains some bioluminescent phytoplankton. Sometimes the swirling action of the water will excite them, and we’ll see blue-green sparkles and flashes as the water washes down. (Sewage and waste water are biologically treated on board so that they are safe to release into the ocean.)

I want to thank the crew of the ship, especially the NOAA Corps officers who have welcomed me on the bridge and answered many questions about ship operations. I am particularly grateful to Capt. Jim Illg, who reviewed all of my logs, and Ensign Patrick Murphy, who answered many questions about weather and navigation.

Finally, I want to thank the scientists who willingly shared their knowledge and patiently taught me protocols for their work. Jerry Prezioso, a NOAA oceanographer, served as chief scientist on this cruise. He helped me prepare ahead of time via telephone and email, and has been endlessly helpful to this novice seafarer. His enthusiasm is infectious, and he has a knack for turning any event into a positive experience. Jackie Anderson, a NOAA marine taxonomist, taught me to operate the CTD unit and helped me identify the kinds of zooplankton we captured in the bongo nets. Don Cobb, an EPA marine environmental scientist, helped me understand the kinds of research the EPA is doing to monitor the health of our oceans and estuaries. Thanks to all of them for their  work in keeping Planet Earth healthy, and for making this an experience I can take back to my classroom and use to help make science real for my students.

Today’s Answer: The intermediate directions are those that fall between the cardinal directions, so to find their degree equivalents, find the halfway point between the numbers for each cardinal direction. Northeast would be at 45°, southeast would be at 135°, southwest would be at 225°, and northwest would be at 315°.

Joan Raybourn, August 23, 2005

NOAA Teacher at Sea
Joan Raybourn
Onboard NOAA Ship Albatross IV
August 14 – 25, 2005

Mission: Ecosystem Productivity Survey
Geographical Area: Northeast U.S.
Date: August 23, 2005

Weather Data from the Bridge

Latitude: 44°23’ N
Longitude: 66°37’ W
Visibility: 10 miles
Wind direction: W (270 degrees)
Wind speed: 12.7 knots
Sea wave height: 1’
Sea swell height: 1’
Sea water temperature: 11.1°C
Sea level pressure: 1014.7 millibars
Cloud cover: 1/8 Clear with a few cumulus clouds low on the horizon

Question of the Day: What does “GMT” stand for and how does it affect the date in the log information above?

Yesterday’s Answer: The clock shows 9:17 a.m. There are 24 hours around the clock face. The hour hand is pointing a little past the 9, so that is the hour. To read the minute hand, notice its position. On a twelve-hour clock, this position would indicate about 17 minutes past the hour. Since this clock counts off 24 hours instead of counting to 12 twice, the afternoon and evening hours have their own numbers. For example, 4:00 p.m. on a twelve-hour clock would be 16:00 on a twenty-four-hour clock. There is no need to indicate a.m. or p.m. since each hour has its own unique number.

12

Science and Technology Log

Today I spent some time up on the bridge talking to the crew about weather. The ship collects all kinds of weather data from on-board sensors, including air temperature, air pressure, wind speed and direction, and relative humidity. It also receives weather data from sources outside the ship via satellite link and email. I was especially interested in how the crew determines visibility, cloud cover, sea wave height, and sea swell height, since these represent subjective data. “Subjective” means that someone uses known data and their own experience to make a judgment. Here are some examples.

Visibility just means how far you can see into the distance. This is very hard to judge on the sea because there are no reference points – no objects to “go by” to decide how far away something is. Radar gives an accurate distance from the Albatross IV to objects such as other ships, and on a clear day, the horizon is about twelve miles away. A navigator learns to estimate visibility by combining radar information with how far away objects look in relation to the horizon. It takes a lot of practice to be able to judge visibility using only your eyes!

Cloud cover just means the amount of the sky that is covered by clouds. This is expressed in eighths. Today the cloud cover was about 1/8, meaning about one eighth of the sky had clouds and seven eighths was clear. To make the estimate, mentally divide the sky in half and ask yourself if about half of the sky is cloudy. If you see that less than half the sky has clouds, then mentally divide the sky into fourths, and then eighths. This can be tricky if the clouds are scattered around because it is hard to see a fraction that isn’t all “together”. Once again, this skill takes a lot of practice.

Sea swell height and sea wave height are both descriptors of how the ocean surface is behaving. These are important to observe because they affect the motion of the ship. Swells are large rolling humps of water that are created by the winds from storms. Navigators can tell how far away the storm is by observing the speed of, and length between, the swells. The ship might rock with long, slow swells caused by a storm hundreds of miles away, or with the shorter, faster swells of a storm that is closer. Waves, on the other hand, are caused by local wind; that is, the wind that is blowing right at your location. Waves might just be rippling the water if the wind is light, but can be large if the wind is strong. Both swell height and wave height are estimated in feet from the trough (bottom) to the crest (top) of the wave. Again, this skill takes lots of practice.

Personal Log

Yesterday we got word that a pod of about seventy right whales had been sighted in the Bay of Fundy. This represents a large fraction of this endangered species’ entire population of fewer than 300. Our route has taken us up a little way into the bay, and we have been eagerly watching for whales. We’ve seen several blows in the distance, and occasionally a glimpse of a long back breaking the water. Most of them have been fin whales, but we did see two or three right whales before it was completely dark. It’s exciting to see these giants of the ocean and we hope to see more when the sun comes up.

Joan Raybourn, August 22, 2005

NOAA Teacher at Sea
Joan Raybourn
Onboard NOAA Ship Albatross IV
August 14 – 25, 2005

Mission: Ecosystem Productivity Survey
Geographical Area: Northeast U.S.
Date: August 22, 2005

Weather Data from the Bridge

Latitude: 42°17’ N
Longitude: 69°38’ W
Wind direction: SE (130 degrees)
Wind speed: 10.3 knots
Air Temperature: 19°C
Sea water temperature: 21.8°C
Sea level pressure: 1016.5 millibars
Cloud cover: High, thin cirrus

Question of the Day: What time does the 24-hour clock in picture #7 show?

Yesterday’s Answer: Sediment is composed of all the small particles of “stuff” that sink to the ocean floor. Near the coast, fresh water is flowing into the ocean from rivers and streams, and human activity creates more matter that is flushed into the ocean. Because there are more sources of sediment near the coast, it collects more quickly there than it does in the open sea.

10

11

Science and Technology Log

Advances in computer technology have made the process of collecting plankton and water samples much easier than it was in the past. During a plankton tow or a water cast, many different people are working together from different parts of the ship, and technology makes it easier to communicate, obtain plankton and water samples from precise locations, and protect equipment from damage. The ship’s crew navigates the ship to the exact station location and maintains the location while the samples are collected, there are scientists and crew members on the aft deck handling the collection equipment, a crew member operates the winch to lift and move the equipment, and a scientist operates the computer system that collects data from the Conductivity, Temperature, and Depth instrument (CTD).

The stations, or places where we will collect samples, are designated in advance of the trip and plotted on a computer map. A computer chooses the stations randomly so that we get information from all over the area with no accidental human pattern. The ship’s commanding officer and the head scientist work together to determine the course the ship will take to visit each station. Many factors must be considered, including efficiency, fuel conservation, and weather. Once the course is set, the chief scientist “connects the dots” on the computer map. Then it is easy to see where we are going next, how far away it is, and when we can expect to be there. “Are we there yet?” is a question asked not only by children on vacations, but by scientists and crew at sea!

When the ship approaches a station, the bridge crew makes an announcement so that everyone knows to get ready. “Ten minutes to bongo” means that it is time for the CTD operator to fire up the computer, for the winch operator to get set, and for the deck crew and scientists to get into their gear and make sure the equipment is ready to go. There is a video camera on the aft deck that enables everyone inside to see what is happening on the deck. This makes it easier to coordinate the collection process and to act quickly if there is an emergency.

When the ship is at the exact position of the station, the bridge radios the winch operator. He in turn lets the CTD operator know that we are ready to begin. The CTD person starts the computer program and tells the deck crew to turn the CTD on. The winch operator lifts the equipment and casts it over the side of the ship into the ocean. The “cast” might have just the CTD unit, or water bottles to collect water samples, or the bongos to collect plankton samples. The CTD goes down on every cast since it is collecting data that is important for the success of the tow as well as for further study.

During the cast, the CTD operator watches the computer display to make sure collections are made at the correct water depths. He or she talks to the winch operator over a walkie-talkie so that he knows how far to drop the line and when to pull it back up.  Plankton is collected at about 5 meters above the ocean floor. The ship’s computer tells us how deep the water is and the CTD tells us how deep the instrument itself is. By comparing these two numbers, the CTD person can make sure the equipment doesn’t drag the bottom, which would damage it and contaminate the samples. Once the CTD and the collection equipment are out of the water, the unit is turned off and the CTD operator finishes up the data collection process by entering information such as date, time, latitude, longitude, station and cast numbers. We just finished Station #75, and will be doing our 100th cast at the next station. (More than one cast is done at some stations.) Sample collections at each station can take anywhere from about 20 minutes for a relatively shallow plankton tow to about 2 hours if we are in deep water and collecting plankton, water, and sediment.

During the cast, the CTD operator can watch as the computer creates line graphs showing the data that is being recorded by the CTD unit. In picture #6 above, the line graph on the right shows the depth, while the graph on the left shows the sea temperature in red, the density of the water in yellow, salinity in blue, and fluorescence in green. Density is kind of like how “thick” the water is, salinity is how salty it is, and fluorescence is a measure of phytoplankton. Line graphs show change over time, so we can see how these values change while the CTD is in the water.

Personal Log

Some adaptations take longer than others. Since I switched watches, I have never been completely sure of what day it is, and when I get up in late morning, I’m always surprised to see lunch being served instead of breakfast. However, I have learned to use the physics of the ship’s motion to make everyday tasks easier. Carrying a heavy load up the stairs is easier if you wait for a swell to lift the ship and give you a little boost, and opening doors and drawers, standing up, and even drinking water is easier if you do it with, rather than against, the roll of the ship. As much as I staggered around for the first two days of the cruise, I wonder now if dry land will feel odd when we get there at the end of the week.

Joan Raybourn, August 21, 2005

NOAA Teacher at Sea
Joan Raybourn
Onboard NOAA Ship Albatross IV
August 14 – 25, 2005

Mission: Ecosystem Productivity Survey
Geographical Area: Northeast U.S.
Date: August 21, 2005

Weather Data from the Bridge

Latitude: 42°17’ N
Longitude: 69°38’ W
Wind direction: SE (130 degrees)
Wind speed: 10.3 knots
Air Temperature: 19°C
Sea water temperature: 21.8°C
Sea level pressure: 1016.5 millibars
Cloud cover: High, thin cirrus

Question of the Day: Why does sediment collect on the ocean floor more rapidly near the coast than it does further out in the ocean?

Yesterday’s Answer: The stern of the ship is at the back, and the sun rises in the east, so the ship must have been heading west.

9

Science and Technology Log

On this cruise, there are actually two separate but complementary kinds of research going on. We have two scientists from the Environmental Protection Agency (EPA) who are collecting samples of the sediment on the ocean floor, which will be analyzed both biologically and chemically. Biology is the study of living things, so the scientists will look to see what organisms are living in the top layer of the ocean floor. The chemical analysis will show what non-living substances, mainly nitrogen and phosphorus compounds, are present. Chemicals may occur naturally, or may be a result of pollution. This work gives us information about human influence on the ocean ecosystem.

To collect the ocean floor sample, scientists use a sediment grab (picture #1). The “grab” is lowered into the ocean until it hits the bottom, where the container closes and “grabs” a sample of whatever is down there. Then it is hauled back to the surface and opened to see what has been collected. There could be sand, silt, mud, rocks, and any creatures living at the bottom of the ocean. There are two chambers in the grab. From one chamber, the top 2-3 cm of sediment are scooped into a pot, mixed up, and put in jars for later chemical analysis. This thin top layer will yield information about the most recent deposits of sediment. Near the coast, that sample may represent matter that has settled to the ocean floor over a year or so. Further out, that much sediment would take several years to deposit. The contents of the other chamber are dumped into a bucket and washed through a sieve to remove the sediment and leave only the biological parts.

The sieves used for the sediment sample are very much like the ones used for the plankton samples, but bigger and with larger mesh at the bottom (picture #4). The bigger “holes” in the mesh allow silt and sand to be washed out. Whatever is left in the sieve is put into jars and stored in coolers for later analysis. The sample contains evidence of what lives in the benthic layer, the top layer of the ocean floor. This evidence could be plankton, worm tubes, or remains of once-living animals.

At each station where a sediment grab is performed, three water samples are taken, one each from the bottom, the middle, and the surface of the ocean. One liter of each water sample is filtered (picture #6) to analyze its nutrient content. This process is somewhat similar to the chlorophyll filtering I described in yesterday’s log. The filters are saved to be analyzed in laboratories, which will look for both dissolved nutrients and particulate matter. Dissolved nutrients are like the sugar that dissolves in your cup of tea – you can’t see it, but it’s still there. Particulate matter consists of tiny bits (particles) of things such as plankton, whale feces, plants, anything that might be swirling around in the ocean.

The EPA is primarily concerned with human influences on natural environments. By collecting sediment and water data, scientists can see what substances humans are putting into the ocean, and what effects they are having on the plants and animals living there. This work meshes well with the plankton research work, since the health of the plankton is directly influenced by the health of its environment. Everything in the natural world is connected, and we humans must learn how to balance our wants and needs with the needs of all other living things. If we are not careful about how we use our Earth, we will upset the balance of nature and create negative consequences that we may not see for years. For example, if chemicals dumped into the ocean (on purpose or accidentally) kill large numbers of phytoplankton, then the entire food web will be disrupted in a kind of ripple effect, like a stone dropped into a pond. The zooplankton (who eat phytoplankton) will starve, and the animals that eat zooplankton will either starve or move to a different part of the ocean, which in turn changes that part of the ecosystem. From this very small example, maybe you can see how huge our responsibility is to keep our oceans (and other environments) clean.

Personal Log

I am so grateful to Jerry Prezioso, our NOAA chief scientist, and Don Cobb, our EPA scientist. They have included me in all of their operations from Day 1, and have been infinitely patient with my many questions. They have explained things over and over until I “got it”, from procedures for collecting samples to the science behind all their work. It has been eye-opening to be on the student side of learning. Many times I have not even had enough background knowledge to know what questions to ask, or have been almost paralyzed with fear that I might do something wrong and skew someone’s data. I know this experience will help me better understand my students who go through these same feelings of anxiety and joy when they are learning something new.