Marilyn Frydrych, September 16, 2008

NOAA Teacher at Sea
Marilyn Frydrych
Onboard NOAA Ship Delaware II
September 15-25, 2008

Mission: Atlantic Herring Hydroacoustic Survey
Geographical area of cruise: New England Coastal Waters
Date: September 16, 2008

The Newston net hanging from a pulley on the A-frame

Weather Data from the Bridge 
41.27 degrees N, 70.19 degrees W
Partly Cloudy
Wind out of the W at 19 knots
Dry Bulb Temperature: 26.0 degrees Celsius
Wet Bulb Temperature: 20.9 degrees Celsius
Waves: 2 feet
Visibility: 10 miles
Sea Surface Temperature: 21.6 degrees Celsius

Science and Technology Log

Today started slowly since we were still in transit to our starting position.  All morning there were 15 to 20 terns and gulls flying nearby.  Occasionally we’d spot land birds.  A small yellow-rumped warbler actually flew into the dry lab area of the boat. It was far from where it belonged and probably wouldn’t make it back.  The terns skimmed the water surface, but never actually seemed to touch the water.  Our bird scientists, Marie-Caroline Martin and Timothy White, decided they would deploy a Newston net to try to determine what the birds were eating. The fishermen, who do all the deploying of instruments, hung the net from the A-frame pulley on the starboard side and swung it out over the water. For 20 minutes it bounced in and out of the water never getting more than a foot or so above or below the surface. The Neuston fine mesh net is about 10 feet long and has a mouth about 4 feet by 2 feet.

Jim Pontz, a fisherman, working the A-frame.

When the fishermen brought it in, it mostly held salp and  jellyfish, but also some small crustaceans which looked like miniature shrimp about 1/2 in. long.  The jellyfish were small, without stingers.  Marie carefully washed the contents of the net down to its opening with a salt water hose.  Then she used her unprotected hands to slide her catch into a glass jar about the size of a medium peanut butter jar. She graciously separated a few of the crustaceans for us to observe. About 11:30 a.m. we finally reached our starting point. The plan was to do parallel north-south transects.  We would cross the east-west transects without stopping . We fished with a huge net off the stern. The chief scientist, Dr Michael Jech, decided when to fish. Sometimes he put the net in to prove that there were no herring there and the echoes he was receiving were correct.  Other times he saw a new signature on the screen and checked to see what it might have been.  Still other times he recognized the herring signature (he’s about 90% accurate) and  fished to determine sizes, sexes, and stomach content.  At other times he had predetermined stations where fishing had been good in the past.

A herring in a clothes basket. Note the brilliant blue stripe on top.

At each 90 degree turn we deployed a CTD – conductivity, temperature, and depth instrument. The instrument measured how easily electricity can flow through the seawater, its conductivity. From this and the temperature and pressure (or depth) the salinity of the water can be determined.  The equations involve the 5th power of both temperature and pressure. They appear to be Taylor’s series approximations.  The CTD is also used to calculate the speed of sound which is important for the accuracy of the sonar equipment.  Only the crew may actually deploy instruments.  None of the scientists touch the instruments going over the side. The scientific crew’s job was to communicate via a handheld radio with the fishermen working the winch and the one putting the instrument into the water.  We told them when to start after we had initialized the computer programs and when to haul back the CTD as it came within a few feet of the ocean bottom. We could simultaneously look at a cam on a nearby monitor showing what was happening at the A frame.  I watched the first time this was done, but with everyone’s help soon caught on and was doing it myself.

Jacquie Ostrom at her post radioing the fishermen when to start the CTD

The second time I helped with the CTD we attached a Niskin water bottle to the bottom of the CTD and signaled to have it stopped about half way back up the ever present bottom layer isotherm.  We paused for about a minute as it filled with the surrounding water.  At that point both ends were wide open. A fisherman dropped a messenger, a heavy round metal doughnut, down the line to the bottle.  It tripped a lever which then allowed the lids connected with tremendously strong elastic bands to snap shut.  The tube is a little larger than a 2-liter soda bottle. When we were given the retrieved bottle, we washed out a small, maybe 1-cup, bottle 3 times with the seawater from the Niskin bottle before we filled and capped it and replaced it in its position in a crate.  The water can be used to calibrate the salinity readings the CTD recorded and to determine various other chemicals at that spot of collection in the ocean.

Sunset silhouetting the CTD bottle balancing against one arm of the A-frame.

Personal Log 

Today being the first full day at sea I was introduced to a wonderful daily ritual. Each morning at about 10:30 the chiefs brought out from the oven their first baked dessert of the day. Today’s was the most perfectly seasoned peach cobbler I’ve ever tasted. Once toward evening we spotted dolphins around the ship. We could occasionally see them jumping through the air. A pair played in the bow wake for a short while. About the same time the crew pointed out to us some three or four pilot whales about 100 yards off the starboard stern. I hadn’t expected to see so much sea life.  This is turning into a very memorable adventure.


Marilyn Frydrych, September 15, 2008

NOAA Teacher at Sea
Marilyn Frydrych
Onboard NOAA Ship Delaware II
September 15-25, 2008

Mission: Atlantic Herring Hydroacoustic Survey
Geographical area of cruise: New England Coastal Waters
Date: September 15, 2008

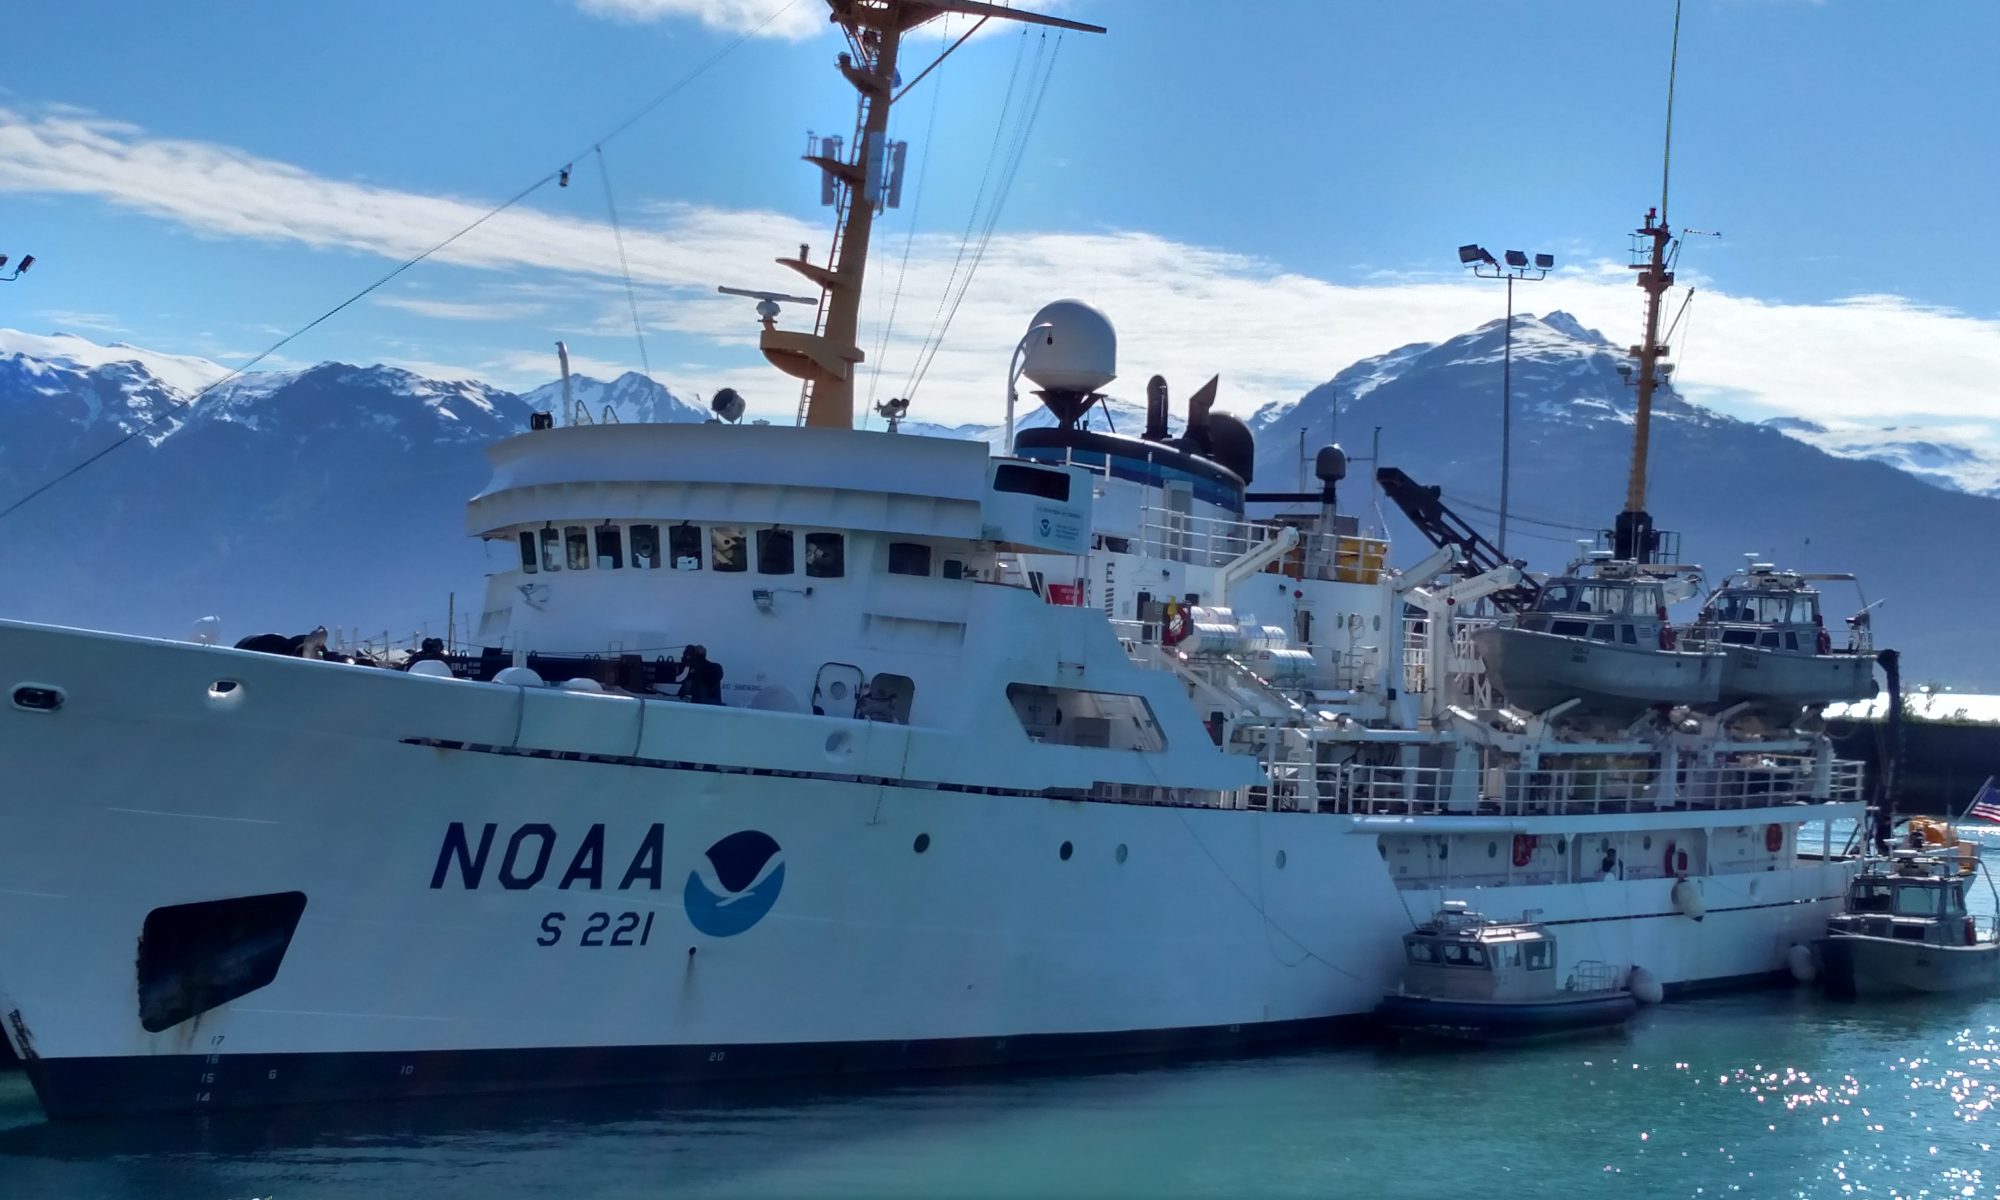
The Delaware II  (Photo courtesy Jacquie Ostram)
The Delaware II (Photo courtesy Jacquie Ostram)

Weather Data from the Bridge 
41.27 degrees N, 70.19 degrees W
Partly Cloudy
Wind out of the W at 19 knots
Dry Bulb Temperature: 26.0 degrees Celsius
Wet Bulb Temperature: 20.9 degrees Celsius
Waves: 2 feet
Visibility: 10 miles
Sea Surface Temperature: 21.6 degrees Celsius

Science and Technology Log 

The purpose of my trip on the Delaware II was to find interesting venues for presenting various math lessons to students at Pikes Peak Community College where I teach and to students of different grades and ages at the K-12 public schools in Colorado Springs. We left on time yesterday, though I was unaware of the departure. I had been busy unpacking my things and making my bed.  Then I decided to learn my way around the boat.  I happened to look through a porthole and noticed we were about 25 yards from the peer.  The NOAA Corps officer, ENS Charlene Felkley, taking us out had used the bow thruster to move us away from the dock. It was so smooth that I hadn’t noticed any movement.  I thought that strange considering the size of the Delaware 2.  We steamed all day toward our station about 250 miles east of Cape Cod. 

NOAA’s dock at Woods Hole, Massachusetts

After we were out of the channel we started our drills.  We’d all been given a station billet stating where our stations were for emergencies.  The first was a fire drill followed by an abandon ship drill. I started to my station at the stern for the fire drill, but one of the engineers redirected me to the bow stating that the fire was in the stern.  About 15 of us gathered in the bow. We had all carried our survival suit, life vest, long sleeve shirt, hat and gloves, and anything we thought we might need.  I brought as extras my sunglasses and a bottle of water. When we were dismissed, about 15 minutes later after the officers and crew had practiced using the fire hoses by spaying over the side of the boat, we proceeded to the stern where those of us who had not been on the last cruise dressed in our survival suits.  I soon learned that the easiest way to put on a survival suit is to stretch the legs and boots out on the deck, sit down in its middle, draw its legs onto your legs, stand up and finish with the upper body. Pulling the zipper up proved quite difficult.  The hood enveloped my face and I could feel its suction.  The suit is designed to keep the cold water away from your body. It was well insulated but still in icy cold waters would only protect you for about an hour.

Jacquie Ostrom and Marilyn on the bow

Personal Log 

That evening we spotted some whales spouting.  It was migration time so we must have been crossing their path as they headed south. We were told they were probably humpback whales because of their size and the shape of their spouts.  I saw a couple fins, but mostly just their massive bodies surfacing.  I learned about “fin prints” the spot where their fin flattens the water.  The little ripples, prevalent everywhere on the ocean’s surface, seem to be smoothed out at the spot where the fin hits the water. These areas were about 6 ft by 4 ft and glistened smooth in the setting sun. We watched spout after spout for about 2 hours.

Marilyn and Debbie Duarte on the bow
Our four bunk room.  Debbie Durate on the night shift and Jacquie Ostrom and I on the day shift shared this room.  It was understood we were not to return to the room any time during our 12 hour shift. The shower is behind the sink and not much wider.
Our four bunk room. Debbie Durate on the night shift and Jacquie Ostrom and I on the day shift shared this room. It was understood we were not to return to the room any time during our 12 hour shift. The shower is behind the sink and not much wider.
Marilyn in survival suit
Robert Gambel, scientist, standing in front of our fishing net ready to put on his survival suit

Mary Anne Pella-Donnelly, September 15, 2008

NOAA Teacher at Sea
Mary Anne Pella-Donnelly
Onboard NOAA Ship David Jordan Starr
September 8-22, 2008

Mission: Leatherback Use of Temperate Habitats (LUTH) Survey
Geographical Area: Pacific Ocean –San Francisco to San Diego
Date: September 15, 2008

Weather Data from the Bridge 
Latitude: 3720.718 N Longitude: 12230.301
Wind Direction: 69 (compass reading) NW
Wind Speed: 12.0 knots
Surface Temperature: 15.056

Computer generated images showing acoustic scattering during the day

Science and Technology Log 

A lot of physical science is involved in oceanographic research.  An understanding of wave mechanics is utilized to obtain sonar readings. This means that sound waves of certain frequencies are emitted from a source.  The concepts to understand in order to utilize acoustic readings are:

  1. Sound and electromagnetic waves travel in a straight line from their source and are reflected when they contact an object they cannot pass through.
  2. Frequency is defined as the number of waves that pass a given point per second (or another set period of time).  The faster the wave travels, the greater the number of waves that go past a point in that time. Waves with a high frequency are moving faster than those with a low frequency. Those waves travel out in a straight line until they contact an object of a density that causes them to reflect back.
  3. The speed with which the waves return, along with the wavelength they were sent at, gives a ‘shadow’ of how dense the object is that reflected the wave, and gives an indication of the distance that object is from the wave source (echo sounder). As jellyfish, zooplankton and other organisms are brought up either with the bongo net or the trawl net, examinations of the acoustic readings are done to begin to match the readings with organisms in the area at the time of the readings.  On the first leg of the survey, there were acoustic patterns that appeared to match conditions that are known to be favorable to jellyfish.  Turtle researchers have, for years, observed certain characteristics of stretches of ocean water that have been associated with sea nettle, ocean sunfish and leatherbacks. Now, by combining acoustic readings, salinity, temperature and chlorophyll measurements, scientists can determine what the exact oceanographic features are that make up ‘turtle water’.
Computer generated images showing acoustic scattering at night.
Computer images of acoustic scattering at night.

Acoustic data, consisting of the returns of pulses of sound from targets in the water column, is now used routinely to determine fish distribution and abundance, for commercial fishing and scientific research. This type of data has begun to be used to quantify the biomass and distribution of zooplankton and micronekton. Sound waves are continuously emitted from the ship down to the ocean floor. Four frequencies of waves are transmitted from the echo-sounder.  The data is retrieved and converted into computerized images. Both photo 1 and photo 2 give the acoustic readings. The “Y” axis is depth down to different depths, depending on the location.  The frequencies shown are as follows for the four charts on the computer screen; top left is 38kHz, bottom left is 70 kHz, top right is 120kHz and bottom right is 200 kHz.  In general the higher frequencies will pick up the smallest particles (organisms) while the lowest reflect off the largest objects. Photo 1 shows a deep-water set of images, with small organisms near the surface. This matches the fact that zooplankton rise close to the surface at night.  Photo 2 gives a daylight reading.

A Leach’s storm petrel rests on the trawl net container.

It is more difficult to interpret.  The upper one-fourth is the acoustic reading and the first distinct horizontal line from the top represents the ocean floor.  Images below that line are the result of the waves bouncing back and forth, giving a shadow reading.  But the team here was very excited: for this set of images shows an abundance of organisms very near the surface. And the trawl that was deployed at that time resulted in lots and lots of jellyfish.  They matched.  Periodically, as the acoustic data is collected, samples are also collected at various depths to ‘ground truth’ the readings.  This also allows the scientists to refine their interpretations of the measurements.  The technology now can give estimates of size, movement and acoustic properties of individual planktonic organisms, along with those of fish and marine mammals.  Acoustic data is used to map the distribution of jellyfish and estimate the abundance in this region. By examining many acoustic readings and jellyfish netted, the scientists will be able to identify the acoustic pattern from jellyfish.

Karin releases a petrel from nets he flew into.

The sensor for the acoustic equipment is mounted into the hull, with readings taken continually.  Background noise from the ship must be accounted for, along with other types of background noise. Some events observed on board, such as a school of dolphins being sighted, can be correlated (matched) to acoustic readings aboard the ship.  Since it is assumed that only a portion of the dolphins in a pod are actually sighted, with the remaining under the surface, the acoustic correlation gives an indication of population size in the pod.  The goal of continued acoustic analysis is to be able to monitor long term changes in zooplankton or micronekton biomass. This monitoring can then lead to understanding the migration, feeding strategies and monitor changes in populations of marine species.

A Wilson’s warbler rests on the flying deck.

Personal Log 

Several small birds have stopped in over the week, taking refuge on the Jordan. Many bird species make long migrations, often at high altitude, along the Pacific flyway.  Some will die of exhaustion along the way, or starvation, and some get blown off their original course.  Most ships out at sea appear to be an island, a refuge for tired birds to land on.  They may stay for a day, a week, or longer. Their preferred food source may not be available however, and some do not survive on board.  Some die because they are just too tired, or perhaps ill, or for unknown reasons. We have had a few birds, and some have disappeared after two days.  We hope they took off to finish their trip. Since we were in site of land all day today, it could be the dark junco headed to shore. ‘Our’ common redpoll did not survive, so he was ‘buried at sea’, with a little ceremony.  About half an hour ago, a stormy petrel came aboard.  He did not seem well, but after a bit of rest, we watched him take off.  We wish him well.

Words of the Day 

Acoustic data: sound waves (sonar) of certain frequencies that are sent out and bounce off objects, with the speed of return an indication of the objects distance from the origin; Echo sounder: device that emits sonar or acoustic waves Dense or density: how highly packed an object is  measured as mass/volume; Distribution: the number and kind of organisms in an area; Biomass:  the combined mass of a sample of living organisms; Micronekton: free swimming small organisms; Zooplankton: small organisms that move with the current; Pacific flyway: a general area over and next to the Pacific ocean that some species of birds migrate along.

Animals Seen Today 
Leach’s Storm-petrel Oceanodroma leucorhoa
Herring gull Larus argentatus
Heermann’s gull  Larus heermanni
Common murr  Uria aalge
Humpback whale  Megapterea novaeangliae
California sea lion Zalophus californianus
Sooty shearwater Puffinus griseus
Brown pelican Pelecanus occidentalis
Harbor seal Phoca vitulina
Sea nettle jellies Chrysaora fuscescens
Moon jellies Aurelia aurita
Egg yolk jellies Phacellophora camtschatica 

Questions of the Day 
Try this experiment to test sound waves.  Get two bricks or two, 4 inch pieces of 2 x 4 wood blocks. Stand 50 ft opposite a classroom wall, and clap the boards together. Have others stand at the wall so they can see when you clap. Listen for an echo.  Keep moving away and periodically clap again. At some distance, the sound of the clap will hit their ears after you actually finish clapping. With enough distance, the clap will actually be heard after your hands have been brought back out after coming together.

  1. Can you calculate the speed of the sound wave that you generated?
  2. Under what conditions might that speed be changed?
  3. Would weather conditions, which might change the amount of moisture in the air, change the speed? 

Mary Anne Pella-Donnelly, September 13, 2008

NOAA Teacher at Sea
Mary Anne Pella-Donnelly
Onboard NOAA Ship David Jordan Starr
September 8-22, 2008

Mission: Leatherback Use of Temperate Habitats (LUTH) Survey
Geographical Area: Pacific Ocean –San Francisco to San Diego
Date: September 13, 2008

Weather Data from the Bridge 
Latitude: 3645.9407 N Longitude: 12501.4783 W
Wind Direction: 344(compass reading) NE
Wind Speed: 13.5 knots
Surface Temperature: 14.197

Computer generated map of sampling area using satellite and in situ data. The satellite image on the right includes land (white) on the right edge, of the area between San Francisco and San Luis Obispo.

Science and Technology Log 

As the scientific team conducts its research locating areas where jellyfish congregate, they have determined that samples need to be taken along both sides of a warm water/cold water boundary.  The charts below comprise a computer-generated chart of water temperature in the area we are focusing on. The chart on the right was created from remotely sensed data obtained from a satellite, and a small square of that is enlarged on the left. The chart on the left is produced from a computer model that smoothes out the lines and includes data taken continuously from the ship and integrated into the chart. Although hard to read at this resolution, the legend shows where CTD’s have been deployed, along with XBT’s, which record temperature. It also marks where upcoming deployments will take place. Net trawls were also deployed to collect samples of jellyfish that might be in the region. The quest is on for good turtle habitat.

After examining these charts above, please answer the following questions:

  1. What can you tell about the temperature of the water just off the coastline for most of that area of California?
  2. What range temperature of water does it appear that the LUTH survey is currently sampling in?
  3. Would you expect to find the same organisms in each of the samples? Why or why not?
  4. What might cause temperatures to be different in some parts of the ocean?

The Expendable Bathy Thermograph (XBT), consists of a long copper wire shot into the water down to 760 m.  When kept in the water for 2 minutes, the cable registers a signal to a dedicated computer, giving temperature readings along the wire, which are immediately plotted onto a graph.

After looking at this graph, answer the following questions:

  1. What temperature is measured at the surface?
  2. At what depth below the surface does the temperature start to drop dramatically? How many degrees Celsius is the drop?
  3. How many more degrees does the temperature drop, after the initial quick decrease? In how many meters does this gradual drop occur?

The LUTH survey is very interested in finding out whether jellyfish are found in the colder water (yellow and green), and how the distribution changes through the changing temperature of the water. Their questions surround what conditions would allow leatherbacks to travel along certain routes to and from the California coast, and how to identify areas of productivity so that commercial fishing can occur without harming protected species. Every jellyfish caught, either by the net trawls or the bongo net, and oceanographic data collected at the same time, provides more insight into where favorable conditions might exist.

Personal Log 

Computer generated graph of XBT data from 8/28/08 at 18:15:30 (6:15 pm)

It is a very different lifestyle to have a profession that involves living for periods of time aboard a ship. Most of us land-based folks get up, wander through the house, eventually rounding up food and heading off to school or work.  For me, after a day full of movement all over Chico Junior High’s large school grounds, I may go to the store, run errands and then return home to read the paper, clean house, and prepare dinner.  My family will eventually arrive home and we will go over the day’s events.  Here, the crew spends up to 23 days in this home, office and recreational area, away from their families.  Two cooks prepare, serve buffet-style and clean up after all meals; serving at 7am, 11am and 5pm.  During off hours, I have observed T.V. or movie watching, card games in action and some gym use.

Many people have iPods and in some areas music is broadcast. Personal computers with satellite internet capabilities are used, I assume, to communicate with friends and family on land.  It is interesting that the ‘living room’, which is also the mess hall, may have 10 colleagues in it sometimes watching a show. I am used to cooking when I choose, or just making cookies if I want or heading outside to jog with my dog after school. No such activities like that happen here.  Every one in the crew seems to get along, is extremely polite to each other, and is also very pleasant.  It takes a very flexible person to enjoy living on a ship and a certainly love for the ocean.  I am enjoying this very different way of living, and will also enjoy when I can run a few miles through the park again.

Animals Seen Today 
Sea nettle jellies Chrysaora fuscescens
Comb jellies Kiyohimea spp.
Sea gooseberry Pleurobrachia bachei
Common dolphins Delphinus delphis
Jack mackerel Trachurus symmetricus
Wilson’s warbler Wilsonia citrine
Yellow-rumped warbler Dendroica coronata 

Questions for the Day 
1. What part of your regular pattern would be easiest to give up, if you were to live aboard a ship?  Which parts would be hardest?

Mary Anne Pella-Donnelly, September 11, 2008

NOAA Teacher at Sea
Mary Anne Pella-Donnelly
Onboard NOAA Ship David Jordan Starr
September 8-22, 2008

Mission: Leatherback Use of Temperate Habitats (LUTH) Survey
Geographical Area: Pacific Ocean –San Francisco to San Diego
Date: September 11, 2008

CTD deployment
CTD deployment

Weather Data from the Bridge 
Latitude: 3647.6130 W Longitude: 12353.1622 N
Wind Direction: 56 (compass reading) NE
Wind Speed: 25.7 knots
Surface Temperature: 15.295

Science and Technology Log 

One important piece of equipment on many NOAA research ships is the CTD (Conductivity and Temperature with Depth).  This eight chambered water collection device is attached to electronic sensors. When the CTD is deployed below the ocean’s surface, it is dropped carefully to a predetermined depth; today’s was 500 m. All water collection chambers are open for water to flow through. After the oceanographer in charge of deployment examines a computer readout of the CTD after it has been lowered to its’ maximum depth, it is decided at which depths water samples will be collected as the CTD is brought back up.At these intervals, water sample collectors (Niskin bottles) are closed and water collected.  Up to eight samples are collected as it rises to the surface.

CTD reading; salinity, oxygen, pressure, and fluorometer voltage
CTD reading: salinity, oxygen, pressure, and voltage

After the CTD has been secured on deck, each sample is carefully extracted into collection bottles. Each water sample is filtered through a vacuum system in order to extract chlorophyll from that water sample.  The extracted chlorophyll is later run through a fluorometer, which calculates the volume of chlorophyll a and chlorophyll b which indicates the intensity of photosynthetic microorganisms in that layer. Lots of chlorophyll indicates a rich biological region, which may support many types of marine life.  In addition, the CTD collects samples that will be analyzed for the amount of salts they contain in order to confirm the sensors values. Values that change to the left are decreasing. The reading on the top right shows how the temperature, in red, changes very quickly from the surface down to 500 m.  The green indicates some chlorophyll until it drops significantly below 100 m, where light no longer penetrates well. Oxygen levels are in blue, also decreasing with depth.

Questions of the Day 

  1. What is the importance of chlorophyll to marine mammals and amphibians?
  2. Why is an understanding of how pressure and depth below the ocean’s surface are related critical to marine sciences?
Water samples being filtered through a vacuum system to extract chlorophyll.