Emily Whalen: Looking at Lobsters, Moving a 208-foot Boat, and Favorite Creatures, May 5, 2015

NOAA Teacher at Sea
Emily Whalen
Aboard NOAA Ship Henry B. Bigelow
April 27 – May 10, 2015

Mission: Spring Bottom Trawl Survey, Leg IV
Geographical Area of Cruise: Gulf of Maine

Date: May 5, 2015

Weather Data:
Air Temperature:  8.4°C
Water Temperature: 5.1ºC
Wind:  15 knots NW
Seas:  1-2 feet

Science and Technology Log:

Lobsters!

This is a large female lobster.  The claw on the right is called the crusher and the claw on the left is called the ripper.  For scale, consider that this lobster is inside a standard 5-gallon bucket!
This is a large female lobster. The claw on the right is called the crusher and the claw on the left is called the pincer. For scale, consider that this lobster is inside a standard 5-gallon bucket!

Not everything that comes up in the net is a fish.  One of the things that we have caught many of on this trip is Homarus americanus, commonly known as the lobster.  Lobsters are invertebrates, which means they don’t have a backbone or an internal skeleton.  Instead, they have a hard outer shell called an exoskeleton to give their body structure and protect their inner organs.  Because their exoskeleton cannot expand as the lobster grows, a lobster must molt, or shed its shell periodically as it gets bigger.  In the first few years of their lives, lobsters need to molt frequently because they are growing quickly.  More mature lobsters only molt yearly or even every few years.

Another interesting fact about lobsters can regenerate lost body parts.  After a claw or leg is lost, the cells near the damaged area will start to divide to form a new appendage.  The developing structure is delicate and essentially useless while it is growing, but after a few molts, it will be fully functional.

This lobster lost a claw and is in the early stages of regenerating it.  What challenges do you think a single-clawed lobster might face?
This lobster lost a claw and is in the early stages of regenerating it. What challenges do you think a single-clawed lobster might face?
This is a lobster  that has almost completed regenerating a lost claw.
This is a lobster that has almost completed regenerating a lost claw.
This is a lobster with two fully functional claws.  Why do you think each claw has a different shape?
This is a lobster with two fully functional claws. Why do you think each claw has a different shape?

When we catch lobsters, we measure and record the distance from their eye cavity to the posterior end of the carapace.  Many of the lobsters we have caught are similar in size to those you would find at the grocery store, which typically weigh about a little more than pound.  Commercial fishermen can only keep male lobsters that are over 101 millimeters.  Can you guess why?  We have seen some smaller lobsters that measure about 50 millimeters, and also some much larger lobsters that measure as much as 150 millimeters!

These are the calipers used to measure the carapace of each lobster.
This is one of the larger lobsters that we have seen.  Some lobsters can live to be over a hundred, although everyone's best estimate for this one was about 20 years.  I put my hand next to the claw for scale.
This is one of the larger lobsters that we have seen. Some lobsters can live to be over a hundred, although everyone’s best estimate for this one was about 20 years. I put my hand next to the claw so that you could see how big it is!  I wasn’t brave enough to put my hand any closer!

One of the members of my watch is Dr. Joe Kunkel, who is doing something called ‘landmark analysis’ on some of the lobsters that we have caught.  This process involves recording the exact location of 12 specific points on the carapace or shell of each lobster.  Then he compares the relative geometry different lobsters to look for trends and patterns.  In order to do this, he uses a machine called a digitizer.  The machine has a small stylus and a button.  When you push the button, it records the x, y and z position of the stylus.  Once the x,y and z position of all 12 points has been recorded, they are imported into a graphing program that creates an individual profile for each lobster.

Here I am using a digitizer to pinpoint 12 different landmarks on this lobsters carapace, or shell.   So far, the offshore lobsters seem to have different geometry than the onshore lobsters, even though they are the same species.
Here I am using a digitizer to pinpoint 12 different landmarks on this lobsters carapace, or shell. So far, the offshore lobsters seem to have different geometry than the onshore lobsters, even though they are the same species.

So far, it appears that lobsters that are caught inshore have different geometry than lobsters that are caught further offshore.  Typically, an organism’s shape is determined by its genes.  Physical variations between organisms can be the result of different genes, environmental factors or physiological factors like diet or activity.  Dr. Kunkel doesn’t have a certain explanation for the differences between these two groups of lobsters, but it may suggest that lobsters have different activity levels or diet depending on whether they live near the shore our out in deeper waters.  In recent years, a shell disease has decimated lobster populations south of Cape Cod.  This study may give us clues about the cause of this disease, which could someday affect the lobster fishery.

This is a grid that represents the digitization of a lobster.
This is a grid that represents the digitization of a lobster.  The single point on the right hand side represents the rostrum, which is analogous to the nose, and the two points furthest to the left represent the place where the carapace or shell meets the tail.

Moving Forward

In order to move from station to station as we complete our survey, the Bigelow has a powerful propulsion system different from most other types of ships.  Typically, a ship has an engine that burns diesel fuel in order to turn a shaft.  To make the ship move forward (ahead) or backward (astern), the clutch is engaged, which causes the shaft to spin the propeller.  The throttle can then be used to make the shaft spin faster or slower, which speeds up or slows down the boat.   Throttling up and down like this affects the amount of fuel burned.  For those of you who are new drivers, this is similar to how your car gets better or worse gas mileage depending on what type of driving you are doing.

Like this class of ship, the Bigelow has a giant propeller at the stern which is 14 feet across and has 5 blades.  However, the unlike most ships, the propeller on the Bigelow is powered by electricity instead of a combustion engine.  There are four electricity-producing generators on the ship, two large and two small.  The generators burn diesel fuel and convert the stored energy into electricity.  The electricity powers two electric motors, which turn the propeller. While the electricity produced powers the propeller, it is also used for lights, computers, pumps, freezers, radar and everything else on the ship.  There are several benefits to this type of system.  One is that the generators can run independently of each other. Running two or three generators at a time means the ship makes only as much electricity as it needs based on what is happening at the time, so fuel isn’t wasted.  Since the ship can speed up or slow down without revving the engine up or down, the generators can always run at their maximum efficiency.
Also, there is much finer control of the ship’s speed with this system.  In fact, the ship’s speed can be controlled to one tenth of a knot, which would be similar to being able to drive your car at exactly 30.6 or 30.7 mph.  Finally, an added benefit is that the whole system runs quietly, which is an advantage when you are scouting for marine mammals or other living things that are sensitive to sound.

Personal Log

I have seen a lot of fish on this trip, but it would be a lie to say that I don’t have some favorites.  Here are a few of them.  Which one do you think is the coolest?

This is a sea raven.  Most of them are brown and green, but this one was a brilliant yellow.
This is a sea raven. Most of the ones we have seen are  brown and green, but this one was a brilliant yellow
Windowpane flounder.  We have seen many types of flounder, but I think these look the coolest.
Windowpane flounder. We have seen many types of flounder, but I think these are the coolest.
Last night we caught 1,700 kilograms of mackerel like these on the Scotian Shelf!
I find the pattern on this cod particularly striking.
How can you not love this little spoonarm octopus?
This is a particularly colorful four-beard rockling!
This immature cusk eel will lose these colors and eventually grow to be a dull grey color.
These squid have chromatophores, which are cells that can change color.  You can see them in this picture as the reddish purple dots.
These squid have chromatophores, which are cells that can change color. You can see them in this picture as the reddish purple dots.
This lamprey eel has circular rasping teeth that it uses to burrow into its prey.  Even as they ride along the conveyor belt, they are trying to bite into an unsuspecting fish!
This Atlantic hagfish has circular rasping teeth that it uses to burrow into its prey. Even as they ride along the conveyor belt, they are trying to bite into an unsuspecting fish!
You can see the gills of this goosefish by looking deep into its mouth.  This fish has a giant mouth that allows it to each huge meals.  Some of the goosefish we catch have stomachs that are larger than their whole bodies!
You can see the gills of this goosefish by looking deep into its mouth. This fish has a giant mouth that allows it to each huge meals. Some of the goosefish we catch have stomachs that are larger than their whole bodies!
We have only seen one of these little blue lumpfish.  While most fish feel slippery and slimy, this one has a rough skin.
We have only seen one of these little blue lumpfish. While most fish feel slippery and slimy, this one has a rough skin.

Emily Whalen: Station 381–Cashes Ledge, May 1, 2015

NOAA Teacher at Sea
Emily Whalen
Aboard NOAA Ship Henry B. Bigelow
April 27 – May 10, 2015

Mission: Spring Bottom Trawl Survey, Leg IV
Geographical Area of Cruise: Gulf of Maine

Date: May 1, 2015

Weather Data from the Bridge:
Winds:  Light and variable
Seas: 1-2ft
Air Temperature:   6.2○ C
Water Temperature:  5.8○ C

Science and Technology Log:

Earlier today I had planned to write about all of the safety features on board the Bigelow and explain how safe they make me feel while I am on board.  However, that was before our first sampling station turned out to be a monster haul!  For most stations I have done so far, it takes about an hour from the time that the net comes back on board to the time that we are cleaning up the wetlab.  At station 381, it took us one minute shy of three hours! So explaining the EEBD and the EPIRB will have to wait so that I can describe the awesome sampling we did at station 381, Cashes Ledge.

This is a screen that shows the boats track around the Gulf of Maine.  The colored lines represent the sea floor as determined by the Olex multibeam.  This information will be stored year after year until we have a complete picture of the sea floor in this area!
This is a screen that shows the boats track around the Gulf of Maine. The colored lines represent the sea floor as determined by the Olex multibeam. This information will be stored year after year until we have a complete picture of the sea floor in this area!

Before I get to describing the actual catch, I want to give you an idea of all of the work that has to be done in the acoustics lab and on the bridge long before the net even gets into the water.

The bridge is the highest enclosed deck on the boat, and it is where the officers work to navigate the ship.  To this end, it is full of nautical charts, screens that give information about the ship’s location and speed, the engine, generators, other ships, radios for communication, weather data and other technical equipment.  After arriving at the latitude and longitude of each sampling station, the officer’s attention turns to the screen that displays information from the Olex Realtime Bathymetry Program, which collects data using a ME70 multibeam sonar device attached to bottom of the hull of the ship .

Traditionally, one of the biggest challenges in trawling has been getting the net caught on the bottom of the ocean.  This is often called getting ‘hung’ and it can happen when the net snags on a big rock, sunken debris, or anything else resting on the sea floor.  The consequences can range from losing a few minutes time working the net free, to tearing or even losing the net. The Olex data is extremely useful because it can essentially paint a picture of the sea floor to ensure that the net doesn’t encounter any obstacles.  Upon arrival at a site, the boat will cruise looking for a clear path that is about a mile long and 300 yards wide.  Only after finding a suitable spot will the net go into the water.

Check out this view of the seafloor.  On the upper half of the screen, there is a dark blue channel that goes between two brightly colored ridges.  That's where we dragged the net and caught all of the fish!
Check out this view of the seafloor. On the upper half of the screen, there is a dark blue channel that goes between two brightly colored ridges. We trawled right between the ridges and caught a lot of really big fish!

The ME70 Multibeam uses sound waves to determine the depth of the ocean at specific points.  It is similar to a simpler, single stream sonar in that it shoots a wave of sound down to the seafloor, waits for it to bounce back up to the ship and then calculates the distance the wave traveled based on the time and the speed of sound through the water, which depends on temperature.  The advantage to using the multibeam is that it shoots out 200 beams of sound at once instead of just one.  This means that with each ‘ping’, or burst of sound energy, we know the depth at many points under the ship instead of just one.  Considering that the multibeam pings at a rate of 2 Hertz to 0.5 Herts, which is once every 0.5 seconds to 2 seconds, that’s a lot of information about the sea floor contour!

This is what the nautical chart for Cashes Ledge looks like. The numbers represent depth in fathoms.  The light blue lines are contour lines.  The places where they are close together represent steep cliffs.  The red line represents the Bigelow’s track. You can see where we trawled as a short jag between the L and the E in the word Ledge

The stations that we sample are randomly selected by a computer program that was written by one of the scientists in the Northeast Fisheries Science Center, who happens to be on board this trip.  Just by chance, station number 381 was on Cashes Ledge, which is an underwater geographical feature that includes jagged cliffs and underwater mountains.  The area has been fished very little because all of the bottom features present many hazards for trawl nets.  In fact, it is currently a protected area, which means the commercial fishing isn’t allowed there.  As a research vessel, we have permission to sample there because we are working to collect data that will provide useful information for stock assessments.

My watch came on duty at noon, at which time the Bigelow was scouting out the bottom and looking for a spot to sample within 1 nautical mile of the latitude and longitude of station 381.  Shortly before 1pm, the CTD dropped and then the net went in the water.  By 1:30, the net was coming back on board the ship, and there was a buzz going around about how big the catch was predicted to be.  As it turns out, the catch was huge!  Once on board, the net empties into the checker, which is usually plenty big enough to hold everything.  This time though, it was overflowing with big, beautiful cod, pollock and haddock.  You can see that one of the deck crew is using a shovel to fill the orange baskets with fish so that they can be taken into the lab and sorted!

You can see the crew working to handling all of the fish we caught at Cashes Ledge.  How many different kinds of fish can you see?
You can see the crew working to handling all of the fish we caught at Cashes Ledge. How many different kinds of fish can you see? Photo by fellow volunteer Joe Warren


At this point, I was standing at the conveyor belt, grabbing slippery fish as quickly as I could and sorting them into baskets.  Big haddock, little haddock, big cod, little cod, pollock, pollock, pollock.  As fast as I could sort, the fish kept coming!  Every basket in the lab was full and everyone was working at top speed to process fish so that we could empty the baskets and fill them up with more fish!  One of the things that was interesting to notice was the variation within each species.  When you see pictures of fish, or just a few fish at a time, they don’t look that different.  But looking at so many all at once, I really saw how some have brighter colors, or fatter bodies or bigger spots.  But only for a moment, because the fish just kept coming and coming and coming!

Finally, the fish were sorted and I headed to my station, where TK, the cutter that I have been working with, had already started processing some of the huge pollock that we had caught.  I helped him maneuver them up onto the lengthing board so that he could measure them and take samples, and we fell into a fish-measuring groove that lasted for two hours.  Grab a fish, take the length, print a label and put it on an envelope, slip the otolith into the envelope, examine the stomach contents, repeat.

Cod, pollock and haddock in baskets
Cod, pollock and haddock in baskets waiting to get counted and measured. Photo by Watch Chief Adam Poquette.

Some of you have asked about the fish that we have seen and so here is a list of the species that we saw at just this one site:

  • Pollock
  • Haddock
  • Atlantic wolffish
  • Cod
  • Goosefish
  • Herring
  • Mackerel
  • Alewife
  • Acadian redfish
  • Alligator fish
  • White hake
  • Red hake
  • American plaice
  • Little skate
  • American lobster
  • Sea raven
  • Thorny skate
  • Red deepsea crab


I think it’s human nature to try to draw conclusions about what we see and do.  If all we knew about the state of our fish populations was based on the data from this one catch, then we might conclude that there are tons of healthy fish stocks in the sea.  However, I know that this is just one small data point in a literal sea of data points and it cannot be considered independently of the others.  Just because this is data that I was able to see, touch and smell doesn’t give it any more validity than other data that I can only see as a point on a map or numbers on a screen.  Eventually, every measurement and sample will be compiled into reports, and it’s that big picture over a long period of time that will really allow give us a better understanding of the state of affairs in the ocean.

Sunset from the deck of the Henry B. Bigelow

Personal Log

Lunges are a bit more challenging on the rocking deck of a ship!

It seems like time is passing faster and faster on board the Bigelow.  I have been getting up each morning and doing a Hero’s Journey workout up on the flying bridge.  One of my shipmates let me borrow a book that is about all of the people who have died trying to climb Mount Washington.  Today I did laundry, and to quote Olaf, putting on my warm and clean sweatshirt fresh out of the dryer was like a warm hug!  I am getting to know the crew and learning how they all ended up here, working on a NOAA ship.  It’s tough to believe but a week from today, I will be wrapping up and getting ready to go back to school!

Emily Whalen: Trawling in Cape Cod Bay, April 29, 2015

NOAA Teacher at Sea
Emily Whalen
Aboard NOAA Ship Henry B. Bigelow
April 27 – May 10, 2015

Mission: Spring Bottom Trawl Survey, Leg IV
Geographical Area of Cruise: Gulf of Maine

Date: April 29, 2015

Weather Data:
GPS location:  4251.770’N, 07043.695’W
Sky condition:  Cloudy
Wind: 10 kts NNW
Wave height: 1-2 feet
Water temperature:  6.2○ C
Air temperature:  8.1○ C

Science and Technology Log:

On board the Henry B. Bigelow we are working to complete the fourth and final leg of the spring bottom trawl survey. Since 1948, NOAA has sent ships along the east coast from Cape Hatteras to the Scotian Shelf to catch, identify, measure and collect the fish and invertebrates from the sea floor. Scientists and fishermen use this data to assess the health of the ocean and make management decisions about fish stocks.

What do you recognize on this chart?  Do you know where Derry, NH is on the map?
This is the area that we will be trawling. Each blue circle represents one of the sites that we will sample. We are covering a LOT of ground! Image courtesy of NOAA.

Today I am going to give you a rundown of the small role that I play in this process. I am on the noon to midnight watch with a crew of six other scientists, which means that we are responsible for processing everything caught in the giant trawl net on board during those hours. During the first three legs of the survey, the Bigelow has sampled over 300 sites. We are working to finish the survey by completing the remaining sites, which are scattered throughout Cape Cod Bay and the Gulf of Maine.  The data collected on this trip will be added to data from similar trips that NOAA has taken each spring for almost 60 years.  These huge sets of data allow scientists to track species that are dwindling, recovering, thriving or shifting habitats.

The CTD ready to deploy.

At each sampling station, the ship first drops a man-sized piece of equipment called a CTD to the sea floor. The CTD measures conductivity, temperature and depth, hence its name.  Using the conductivity measurement, the CTD software also calculates salinity, which is the amount of dissolved salt in the water.  It also has light sensors that are used to measure how much light is penetrating through the water.

While the CTD is in the water,  the deck crew prepares the trawl net and streams it from the back of the ship.  The net is towed by a set of hydraulic winches that are controlled by a sophisticated autotrawl system.  The system senses the tension on each trawl warp and will pay out or reel in cable to ensure that the net is fishing properly.

Once deployed, the net sinks to the bottom and the ship tows it for twenty minutes, which is a little more than one nautical mile. The mouth of the net is rectangular so that it can open up wide and catch the most fish.  The bottom edge of the mouth has something called a rockhopper sweep on it, which is made of a series of heavy disks that roll along the rocky bottom instead of getting hung up or tangled.  The top edge of the net has floats along it to hold it wide open.   There are sensors positioned throughout the net that send data back to the ship about the shape of the net’s mouth, the water temperature on the bottom, the amount of contact with the bottom, the speed of water through the net and the direction that the water is flowing through the net.  It is important that each tow is standardized like this so that the fish populations in the sample areas aren’t misrepresented by the catch.   For example, if the net was twisted or didn’t open properly, the catch might be very small, even in an area that is teaming with fish.

Do you think this is what trawl nets looked like in 1948?
This is what the net looks like when it is coming back on board. The deck hands are guiding the trawl warps onto the big black spools. The whole process is powered by two hydraulic winches.

After twenty minutes, the net is hauled back onto the boat using heavy-duty winches.  The science crew changes into brightly colored foul weather gear and heads to the wet lab, where we wait to see what we’ve caught in the net. The watch chief turns the music up and everyone goes to their station along a conveyor belt the transports the fish from outside on the deck to inside the lab. We sort the catch by species into baskets and buckets, working at a slow, comfortable pace when the catch is small, or at a rapid fire, breakneck speed when the catch is large.

If you guessed 'sponges', then you are correct!
This is the conveyor belt that transports the catch from the deck into the wetlab. The crew works to sort things into buckets. Do you know what these chunky yellow blobs that we caught this time are?

After that, the species and weight of each container is recorded into the Fisheries Scientific Computing System (FSCS), which is an amazing software system that allows our team of seven people to collect an enormous amount of data very quickly. Then we work in teams of two to process each fish at work stations using a barcode scanner, magnetic lengthing board, digital scale, fillet knives, tweezers, two touch screen monitors, a freshwater hose, scannable stickers, envelopes, baggies, jars and finally a conveyor belt that leads to a chute that returns the catch back to the ocean.  To picture what this looks like, imagine a grocery store checkout line crossed with an arcade crossed with a water park crossed with an operating room.  Add in some music playing from an ipod and it’s a pretty raucous scene!

The data that we collect for each fish varies.  At a bare minimum, we will measure the length of the fish, which is electronically transmitted into FSCS.  For some fish, we also record the weight, sex and stage of maturity.  This also often includes taking tissue samples and packaging them up so that they can be studied back at the lab.  Fortunately, for each fish, the FSCS screen automatically prompts us about which measurements need to be taken and samples need to be kept.  For some fish, we cut out and label a small piece of gonad or some scales.  We collect the otoliths, or ear bones from many fish.

It does not look this neat and tidy when we are working!
These are the work stations in the wet lab. The cutters stand on the left processing the fish, and the recorders stand on the right.These bones can be used to determine the age of each fish because they are made of rings of calcium carbonate that accumulate over time.

Most of the samples will got back to the Northeast Fisheries Science Center where they will be processed by NOAA scientists.  Some of them will go to other scientists from universities and other labs who have requested special sampling from the Bigelow.  It’s like we are working on a dozen different research projects all at once!


Something to Think About:

Below are two pictures that I took from the flying bridge as we departed from the Coast Guard Station in Boston. They were taken just moments apart from each other. Why do you think that the area in the first picture has been built up with beautiful skyscrapers while the area in the second picture is filled with shipping containers and industry? Which area do you think is more important to the city? Post your thoughts in the comment section below.

Rows of shipping containers. What do you think is inside them?
Downtown Boston.  Just a mile from the shipping containers.  Why do you think this area is so different from the previous picture?
Downtown Boston. Just a mile from the shipping containers. Why do you think this area is so different from the previous picture?


Personal Log

Believe it or not, I actually feel very relaxed on board the Bigelow!  The food is excellent, my stateroom is comfortable and all I have to do is follow the instructions of the crew and the FSCS.  The internet is fast enough to occasionally check my email, but not fast enough to stream music or obsessively read articles I find on Twitter.  The gentle rocking of the boat is relaxing, and there is a constant supply of coffee and yogurt.  I have already read one whole book (Paper Towns by John Greene) and later tonight I will go to the onboard library and choose another.  That said, I do miss my family and my dog and I’m sure that in a few days I will start to miss my students too!

If the description above doesn’t make you want to consider volunteering on a NOAA cruise, maybe the radical outfits will.  On the left, you can see me trying on my Mustang Suit, which is designed to keep me safe in the unlikely event that the ship sinks.  On the right, you can see me in my stylish yellow foul weather pants.  They look even better when they are covered in sparkling fish scales!

Seriously, they keep me totally dry!
Banana Yellow Pants: SO 2015! Photo taken by fellow volunteer Megan Plourde.
Seriously, do I look awesome, or what?
This is a Mustang Suit. If you owned one of these, where would you most like to wear it? Photo taken by IT Specialist Heidi Marotta.

That’s it for now!  What topics would you like to hear more about?  If you post your questions in the comment section below, I will try to answer them in my next blog post.

Emily Whalen: Making Plans, April 20, 2015

NOAA Teacher at Sea
Emily Whalen
Preparing to Board NOAA Ship Henry B. Bigelow
April 27 – May 10, 2015

Mission: Spring Bottom Trawl Survey, Leg IV
Geographical Area of Cruise: Gulf of Maine

Date: April 20, 2015

Personal Log

Next week I will be boarding the Henry B. Bigelow to participate in the Spring Bottom Trawl Survey as part of the NOAA’s Teacher at Sea (TAS) program.  Before I leave, I am frantically working to assess my student’s work, plan projects for them to work on while I am gone, spending time with my family and also planting seeds in my vegetable garden so that I will return to lovely little green seedlings!   Although this is my first time participating in TAS, it is not the first time I will be headed off to sea for an adventure on a boat.  After graduating from college, I spent several years living and working on sail training vessels where my job was to take kids out sailing and get them excited about the ocean.  One of my favorite things was setting a trawl net and hauling it in by hand so that we could teach kids about whatever fish, invertebrates or plants  we caught.  I always loved the moment the net reached the surface and I could catch a first glimpse at what was inside!

Getting ready to teach kids about a giant sea hare, something we will NOT catch during the bottom trawl survey!
Getting ready to teach kids about a California Sea Hare, something we will NOT catch during the bottom trawl survey!

It was on one of these boats nearly ten years ago that I first heard of the Teacher at Sea program.  I was sailing with a group of high school students from Brooklyn, and one of their teachers had just returned from his TAS trip in Alaska.  At the time I was considering becoming a teacher, but one of the things I was struggling with was the thought of being indoors all day, every day, year after year.  Hearing about his trip made me realize that becoming a classroom teacher didn’t mean I would literally have to stay in the classroom all the time!  In the years since then, I went to graduate school, got married, moved to New Hampshire, taught middle school science for a few years, and most recently started teaching high school science at Next Charter School in Derry, NH.

Spring skiing at Mount Sunapee!
Great spring skiing is one of the perks of living in New Hampshire!

One of the great things about teaching at my school is that we spend lots of time outside the classroom.  I have been able to take kids hiking, running, snowshoeing, to museums and exhibitions, on the T into downtown Boston and even on overnight trips to an island!  In fact as I am typing this, my hands are muddy from taking our students to a state park and building a log bridge as part of an earth day initiative.  As a staff, we are constantly pushing our students to step outside their comfort zone and interact with new people, visit new places and try new things.  Hopefully they realize that this is exactly what I am doing when I head out to sea next week!

Ice skating with some of the students at Next Charter School!

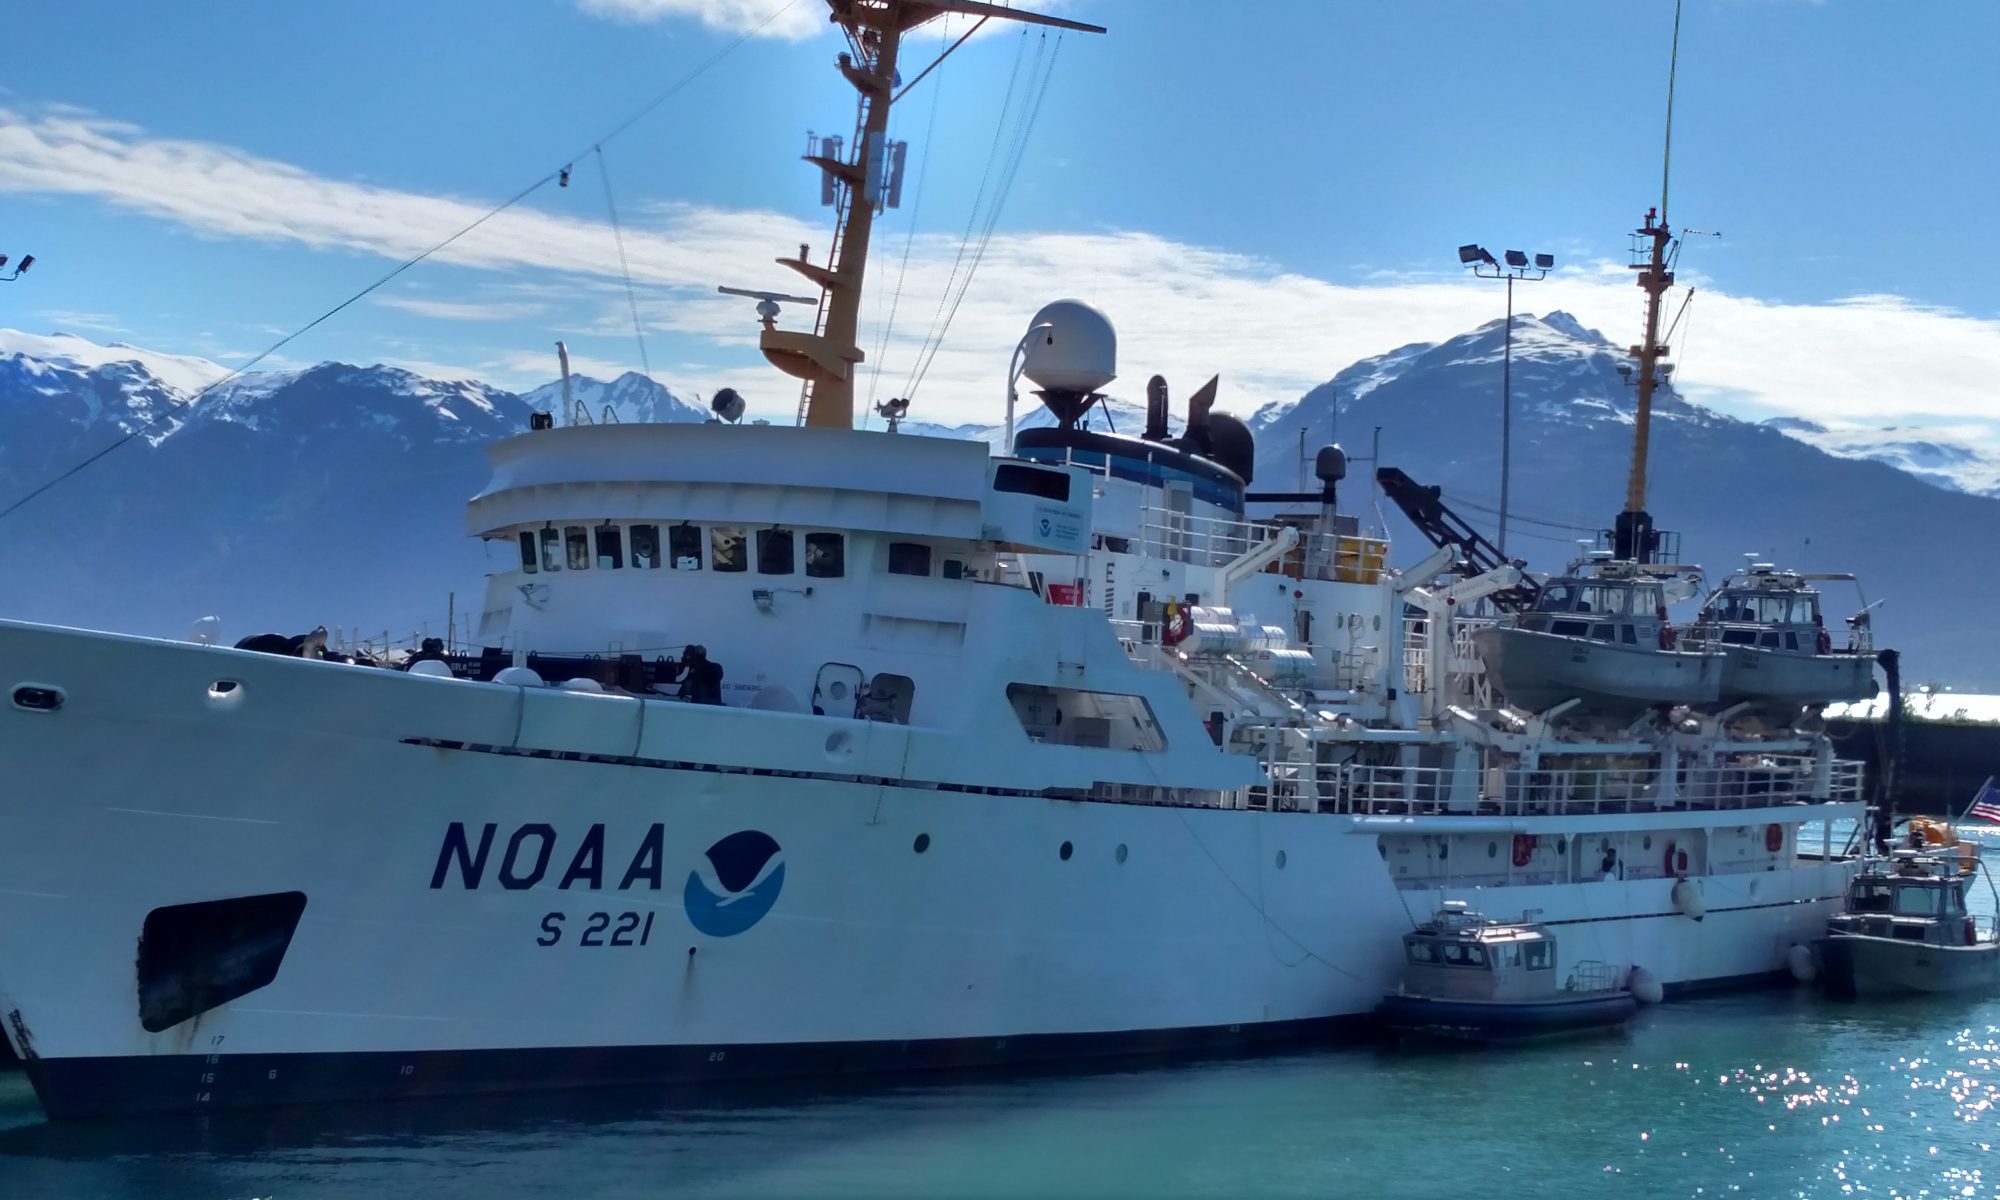
When I leave, I will be spending two weeks on board the Henry B. Bigelow, which is a 208-foot research vessel that was built in Mississippi and launched in 2005.  The boat has a sophisticated equipment on board that allows scientist to track, study and measure marine mammals, fish and other sea creatures.  The hull of the boat is designed to reduce noise, which allows for more accurate measurements and also prevents the animals that scientists are attempting to student from getting scared away.  I’m looking forward to learning more about the ship’s technology and how it allows us to build rich and robust picture of the species of the North Atlantic.

NOAA Research Vessel Henry B. Bigelow
A glamorous shot of the Henry B. Bigelow. Photo courtesy of NOAA.

Another cool thing about this boat is that the name was chosen by a group of high school students from my home state of New Hampshire as a prize for winning a regional NOAA contest.  When I mentioned this to my friend Forrest, who has spent lots of time on the water up and down the east coast, he suggested that the boat may have been named after the same Bigelow as Bigelow Bight, which is a geographical feature several miles east of the New Hampshire coastline.

My daughter Harper and my husband Jared looking out at Bigelow Bight from Portsmouth, NH

After doing a little more research on my own, I learned that Henry Bryant Bigelow was a world renowned marine biologist from Massachusetts who spent his life making great contributions to the field of oceanography.  Aside from a NOAA ship, and marking on a nautical  chart, there are also over two dozen species of algae and protists as well as medal of achievement in oceanography that are named after him!

The next time I write, I will be well underway on my trip!  Please comment below with any questions you have or topics you would like me to write about!