Taylor Planz: What’s It Like to Be a…, July 19, 2018

NOAA Teacher at Sea

Taylor Planz

Aboard NOAA Ship Fairweather

July 9 – 20, 2018

 Mission: Arctic Access Hydrographic Survey
Geographic Area of Cruise: Point Hope, Alaska and vicinity
Date: July 19, 2018 at 10:53am

Weather Data from the Bridge
Latitude: 65° 15.541′ N
Longitude: 168° 50.424′ W
Wind:  10 knots NW, gusts up to 20 knots
Barometer:  765.06 mmHg
Visibility: 8 nautical miles
Temperature: 7.4° C
Sea Surface 7.2° C
Weather: Overcast, light drizzle

Interview Issue!

NOAA hires employees with many different career specialties. So many in fact that I cannot cover them all in one blog post. In an effort to give you a glimpse into some of the day to day happenings of the ship, I chose three different people with widely varying careers to interview today. The first is Oiler Kyle Mosier, who works in the engineering department. Next is Erin Billings, a meteorologist from the National Weather Service visiting NOAA for this leg of the mission. Finally, ENS Jeffrey Calderon who works for the NOAA Commissioned Officer Corps as the Medical Person In Charge.

Oiler Kyle Mosier

Oiler Kyle Mosier
Oiler Kyle Mosier


What is your job on NOAA Ship Fairweather?
“I am an oiler in the engineering department, and my job is to do maintenance work and watches when we are underway. During my work day, I complete a list of maintenance items called a SAMMS list. On a given day, I might clean strainers, air supply, or air filters. We have 5 fan rooms; fan rooms 1 and 3 go to our staterooms, so I make sure those are always clean.”

What tool do you use in your work that you could not live without?
“An adjustable wrench. We use wrenches just about every day, so if I only had one wrench (and one tool) it would be the one that can adjust to many sizes.”

What do you think you would be doing if you were not working on a NOAA ship?
“My dream job is to be a successful writer. I got started in high school just writing for fun, and I got better as I went through college. I also took an art class in college, and the teacher let me work on my own project ideas. I made my first book cover in that class, for a book called “Natalie and the Gift of Life”. I brought back my original character Natalie years later because I loved that first book so much, and I’m a much better writer now versus back then. My most recent book is “Natalie and the Search for Atlantis”.”

What advice would you give to students who may be interested in a job like yours?
“Some people only get certified to be an Oiler, but I went to the Maritime Academy and got my QMED certification (Qualified Member of the Engine Department). I recommend this pathway because it qualifies you to be an electrician, oiler, junior unlicensed engineer, and work in refrigeration. You’re not stuck with one job; instead, you have many different choices for what kind of job you do.”

Erin Billings

Meteorologist Erin Billings

Tell me about what you do for a living.
“I am general forecaster for the National Weather Service in Fairbanks, Alaska. I produce forecasts for northern Alaska and the adjacent waters. As an organization, we forecast for approximately 350,000 square miles of land area.”

What do you enjoy most about your work?
“It’s like putting all the pieces of a puzzle together. Forecasting is a lot about pattern recognition. People also rely a lot on forecasts, so I feel like my job is important for people as they plan their day, their weekend, and even their vacations.”

What parts of your job can be challenging?
“When you have a lot going on and the weather is frequently changing, it can be hard to choose what area gets looked at first as well as managing the time it takes to do that. I work rotating shifts as well, so my work hours are always changing and sometimes I work 7 days in a week. I love what I do though, so there’s a trade off.”

What advice would you give to students who may be interested in a job like yours?
“In order to get in to a meteorological position, you should find a way to set yourself apart from other people. Get a good foundation of science and math, but focus on something else you can bring to the table. Examples could be learning a foreign language, learning computer programming, or completing an internship or relevant volunteer position. Setting yourself apart will make you more competitive than everyone else who is applying for the same job and has the same degree as you.”

Ensign Jeffrey Calderon

Ensign Jeffrey Calderon

What is your job on NOAA Ship Fairweather?
“I am a Junior Officer with the NOAA Commissioned Officer Corps. My job is administration of the ship, which is broken down into collateral duties. Each duty needs to be completed to keep the ship operating smoothly. I am the Medical Person in Charge, so I keep track of all the medicines, make sure they haven’t expired, order medical supplies, and inspect medical equipment. I can also perform CPR and first aid. I can follow a doctor’s order to administer medication, including IVs. I am also in charge of all of the keys on the ship; there are about 300. I have to get them back from people when they leave and make copies when needed. I am the auxiliary data manager on the ship. I collect weather data, inspect the sensors (anemometer, barometer, etc), and upload the data to an online system. I also drive and navigate the ship and the small launch boat.”

What do you enjoy most about your work?
“I like being on a ship because I get to travel and see things that I will remember all my life. On the Fairweather, I get to see the aurora borealis, mountains, fjords, whales… things that not everyone gets to see. It also forces me to face new challenges; there’s always something I have to master and learn. I may have to fight a fire on the ship or go out on a launch and rescue somebody on the water.”

What do you miss the most when you are at sea?
“I miss having a real bed. I miss the privacy too. My stateroom is a 2-person stateroom.”

What advice would you give to students who may be interested in a job like yours?
“Pick a science-related path. It will be challenging, but it will be worth it in the long run. Science degrees will better prepare you for challenging careers, and it will prove to future employers that you can persevere through challenges. NOAA is also looking for people with good moral character, so stay out of trouble.”

Question of the Day
What are the eligibility requirements to be in the NOAA Commissioned Officer Corps?

Answer to Last Question of the Day
As mentioned above, northern Alaska reaches temperatures colder than most people can even imagine! Nome’s record low temperature occurred on January 27, 1989. Without using the internet, how cold do you think Nome got on that day?

The coldest temperature on record in Nome, Alaska is -54° Fahrenheit! Brrrr!
Taylor Planz: Surveying 101, July 18, 2018


NOAA Teacher at Sea
Taylor Planz
Aboard NOAA Ship Fairweather
July 9 – 20, 2018

 Mission: Arctic Access Hydrographic Survey
Geographic Area of Cruise: Point Hope, Alaska and vicinity
Date: July 18, 2018 at 10:15am

Weather Data from the Bridge
Latitude: 66° 24.440′ N
Longitude: 163° 22.281′ W
Wind: 17 knots SW, gusts up to 38 knots
Barometer: 758.31 mmHg
Visibility: 5 nautical miles
Temperature: 12.2° C
Sea Surface 9.6° C
Weather: Overcast, no precipitation

Science and Technology Log

NOAA Ship Fairweather has a variety of assignments in different parts of the west coast each year, mostly in Alaska. They also work with many different organizations. In April of 2018, the US Geological Survey, or USGS, hired the ship to complete the last part of the survey of a fault line, the Queen Charlotte Fault, which lies west of Prince of Wales Island, Alaska. This was a joint venture between the US and Canada because it is the source of frequent and sometimes hazardous earthquakes. The Queen Charlotte Fault lies between the North American Plate and the Pacific Plate. The North American Plate is made of continental crust, and the Pacific Plate is made of oceanic crust. The two plates slide past one another, so the plate boundary is known as a transform, or strike slip, fault.

Queen Charlotte fault area
This image is from the USGS, who have been surveying the Queen Charlotte Fault area for many years. Photo Source: https://soundwaves.usgs.gov/2016/01/

The image to the right came from the USGS. Notice the two black arrows showing the directions of the North American and Pacific plates. Strike slip faults, such as this one, have the potential to produce damaging earthquakes. The San Andreas Fault in California is another example of a strike slip fault. The Queen Charlotte Fault moves relatively fast, with an average rate of 50 mm/year as shown in the photo. The USGS explains the Queen Charlotte fault beautifully in this article.

The image below was created after hydrographers on NOAA Ship Fairweather processed the data from their survey in April. The colors show relative depth across the fault, with red being the shoalest areas and blue being the deepest areas. In the top right section, you can see Noyes Canyon. There are many finger-shaped projections, which are result from sediment runoff. Notice that the color scheme in this area does not have much orange or yellow; it basically goes from red to green. If you were to look at this map in 3-D, you would see in those areas that the sea floor dramatically drops hundreds of meters in a very short distance.

Queen Charlotte Fault and Noyes Canyon
Queen Charlotte Fault and Noyes Canyon. Photo Courtesty of HST Ali Johnson

It is also worth noting what can be found in the remainder of this image. When NOAA finishes their survey, two different products are formed. The first is the colored map, which you see to the far left of the image. This is useful for anyone interested in the scientific components of the area. Mariners need the information as well, but a colored schematic is less useful for marine navigation, so nautical charts are produced (or updated) for their use. A nautical chart looks just like the remainder of this image. Small numbers scattered all over the white part of the map (ie – the water) show the depth in that area. The depth can be given in fathoms, meters, or feet, so it is important to find the map’s key. The purpose of the charts is to communicate to mariners the most navigable areas and the places or obstacles that should be avoided. The nautical charts usually have contour lines as well, which give a better picture of the slope of the sea floor and group areas of similar depth together.

Lower half of Queen Charlotte Fault, photo courtesy of HST Ali Johnson

The photo above is a closer view of the Queen Charlotte Fault. Can you see the fault? If you cannot see it, look at the line that begins in the bottom center of the photo and reaches up and to the left. Do you see it now? On the left side of the fault lies the Pacific Plate, and on the right side lies the North American Plate. If you look even closer, you might find evidence of the plates sliding past each other. The areas that resemble rivers are actually places where sediment runoff imprinted the sea floor. If you observe closely, you can see that some of these runoff areas are shifted at the location of the fault. Scientists can measure the distance between each segment to determine that average rate of movement at this fault line.

I also wanted to briefly mention another small side project we took on during this leg. A tide buoy was installed near Cape Lisburne, which is north of Point Hope. The buoys are equipped with technology to read and communicate the tidal wave heights. This helps hydrographers accurately determine the distance from the sea surface to the sea floor. The buoy will remain at its station until the end of the survey season, at which time it will be returned to the ship.


Personal Log

Northwest Alaska may not be a breathtaking as Southeast Alaska, but it has sure been an interesting trip! It amazes me that small communities of people inhabit towns such as Nome, Point Hope, and Barrow (which is about as far north as one can travel in Alaska) and endure bone-chilling winter temperatures, overpriced groceries, and little to no ground transportation to other cities. Groceries and restaurant meals are expensive because of the efforts that take place to transport the food. During my first day in Nome, I went to a restaurant called the Polar Cafe and paid $16 for an omelette! Although the omelette was delicious, I will not be eating another during my last day in Nome on Friday. It is simply too expensive to justify paying that much money. I also ventured to the local grocery store in hopes of buying some Ginger Ale for the trip. Consuming ginger in almost any form can help soothe stomach aches and relieve seasickness. Unfortunately ginger ale was only available in a 12-pack that happened to be on sale for $11.99. I decided to leave it on the shelf. Luckily the ship store has ginger ale available for purchase! The ship store is also a great place to go when your sweet tooth is calling!

The Ship Store
The Ship Store opens most nights for personnel to buy soda, candy, or even t-shirts!


Did You Know?
The Queen Charlotte fault was the source of Canada’s largest recorded earthquake! The earthquake occurred in 1949 and had a magnitude of 8.1!

Question of the Day
As mentioned above, northern Alaska reaches temperatures colder than most people can even imagine! Nome’s record low temperature occurred on January 27, 1989. Without using the internet, how cold do you think Nome got on that day?

Answer to Last Question of the Day:
How does a personal flotation device (PFD) keep a person from sinking?

When something is less dense than water it floats, and when it is more dense than water it sinks. Something with the same density as water will sit at the surface so that it lies about equal to the water line (picture yourself laying flat on the surface of a lake). Your body is over 50% water, so the density of your body is very close to the density of water and you naturally “half float”. A PFD, on the other hand, is made up of materials which have a lower density than water and they always float completely above water. When you wear a PFD, your body’s total density is a combination of your density and the PFD’s density. Therefore, the total density becomes less than the density of water, and you float!

Sources:
Danny, et al. (2016). Investigating the Offshore Queen Charlotte-Fairweather Fault System in Southeastern Alaska and its Potential to Produce Earthquakes, Tsunamis, and Submarine Landslides. USGS Soundwaves Monthly Newsletter. https://soundwaves.usgs.gov/2016/01/.

Torresan, L (2018). Earthquake Hazards in Southeast Alaska. USGS Pacific Coastal and Marine Science Center. https://walrus.wr.usgs.gov/geohazards/sealaska.html.


Jeff Peterson: The Work in the Western Gulf, July 15, 2018

 NOAA Teacher at Sea

Jeff Peterson

Aboard NOAA Ship Oregon II

July 9 – July 20, 2018


Mission: SEAMAP Summer Groundfish Survey

Geographic Area of Cruise: Gulf of Mexico

Date: July 15, 2018


Weather Data from the Bridge

Date: 2018/07/18

Time: 16:05:45

Latitude: 30 05.44 N

Longitude: 085 52.76 W

Speed over ground: 05.3 knots

Barometric pressure: 1015.62 mbar

Relative humidity: 81%

Air temp: 27.6 C


Science and Technology Log

At the time of writing, we’ve completed the “stations” (i.e., the appointed stops where we trawl to collect specimens) in the western Gulf of Mexico, and are headed to the Florida coast, where we’ll conclude the 3rd leg of the Summer Groundfish Survey. Sometime tonight we’ll arrive and resume work, trawling and identifying fish. What follows is my attempt to furnish a detailed description of where we are and what we’re doing.

Stations: Where We Stop & Why

As I explained in my previous blog post, “Learner at Sea: Day 1,” the survey work being performed on this cruise contributes to a larger collective enterprise called SEAMAP, the Southeast Area Monitoring and Assessment Program. The “sample area” of SEAMAP is considerable, ranging from Texas-Mexico border to the Florida Keys.

image 1 SEAMAP - coverage
Spatial coverage of SEAMAP Summer and Fall Trawl Surveys in the northern Gulf of Mexico

Fisheries biologist Adam Pollack tells me that the total trawlable area–that is, excluding such features as known reefs, oil rigs, and sanctuaries–consists of 228,943.65 square kilometers or 88,943.65 square miles. That’s a piece of ocean of considerable size: nearly as big as Louisiana and Mississippi combined.

SEAMAP divides the sample area into a series of statistically comparable “zones” (there are two zones within each of the numbered areas in the diagram above), taking into account a key variable (or stratum): depth. It then assigns a proportionate number of randomized locations to every zone, arriving at 360-400 stations for the sample area as a whole. Statisticians call this method a “stratified random design.”

While Louisiana, Mississippi,  Alabama, and Florida participate in the SEAMAP, the lion’s share of stations are surveyed by NOAA.

These are the 49 stations we sampled during the first half of the cruise, off the shore of Louisiana:

leg 3 west
Stations covered in the western Gulf during the 3rd leg of the Summer Groundfish Survey

The data from the Summer Survey is analyzed in the fall and available the following spring. NOAA’s assessments are then passed along to the regional Fisheries Management Councils who take them into account in setting guidelines.

The Trawl: How we Get Fish Aboard

NOAA Ship Oregon II brings fish aboard using an otter trawl. As described in “Mississippi Trawl Gear Characterization,” “The basic otter trawl is the most common type of trawl used in Mississippi waters to harvest shrimp. The otter trawl is constructed of twine webbing that when fully deployed makes a cone shape. Floats on the head-rope (top line) and chains on the foot rope (bottom line) of are used to open the mouth of the trawl vertically. To spread the mouth of the trawl open as large as possible, each side (wing) is attached to trawl doors” (http://www.nmfs.noaa.gov/pr/pdfs/strategy/ms_trawl_gear.pdf). Positioned by chains so that their leading edges flare out, those doors are sizable and heavy, 40 inches high and 8 feet long, and help not only to spread the net open (and ‘herd’ fish in) but also to keep it seated on the ocean floor.

An otter trawl deployed

To mitigate environmental harm–and, in particular, to help save inadvertently caught sea turtles—trawling time is limited to 30 minutes. The trawl is 40 feet wide and is dragged over 1.5 miles of ocean bottom.

Here are the trawl’s technical specifications:

Trawl schematic
Trawl schematic, courtesy of NOAA fishing gear specialist Nicholas Hopkins

It should not go without saying that deploying and retrieving gear like this is mission critical, and requires physical might, agility, and vigilance. Those tasks (and others) are performed expertly by the Deck Department, manned on the day watch by Chief Boatswain Tim Martin and Fisherman James Rhue. Fisherman Chris Rawley joins them on the swing shift, coming on deck in the evening.

The process of bringing the trawl aboard looks like this:

doors up
Trawl doors on their way up toward the starboard outrigger
separating
Seizing the “lazy line” with the hook pole
orange section
The “elephant ear” (orange section) secured
cod end at the rail
Chief Boatswain Tim Martin brings a catch over the rail

The bottom of the trawl is secured with a special knot that permits controlled release of the catch.

knot
Among other names, this piece of handiwork is known as the “double daisy chain” or “zipper knot”


The catch emptied into baskets

CTD

Before every trawl, the CTD is deployed from the well deck (port side) to collect data on, as its acronym suggests: Conductivity, Temperature, and Depth. According to NOAA’s Ocean Explorer website, “A CTD device’s primary function is to detect how the conductivity and temperature of the water column changes relative to depth. Conductivity is a measure of how well a solution conducts electricity. Conductivity is directly related to salinity, which is the concentration of salt and other inorganic compounds in seawater. Salinity is one of the most basic measurements used by ocean scientists. When combined with temperature data, salinity measurements can be used to determine seawater density which is a primary driving force for major ocean currents” (https://oceanexplorer.noaa.gov/facts/ctd.html).

The CTD secured on deck


CTD in the water
The CTD suspended at the surface, awaiting descent

During daylight hours, a scientist assists with the deployment of the CTD, contributing observations on wave height and water color. For the latter, we use a Forel-Ule scale, which furnishes a gradation of chemically simulated water colors.


Forel-Ule scale
Forel-Ule scale


The Wet Lab: How We Turn Fish into Information

Once in baskets, the catch is weighed and then taken inside the wet lab.

the wet lab
The wet lab: looking forward. Fish are sorted on the conveyor belt (on the right) and identified, measured, weighed, and sexed using the computers (on the left).

Once inside the wet lab, the catch is emptied onto the conveyor belt

Fish ready for sorting
Snapper on the belt
A small catch with a big Snapper

Next the catch is sorting into smaller, species-specific baskets:

Emily McMullen sorting fish


batfish face
Say hello to the Bat Fish: Ogecephalus declivirostris
Calico Box Crab, Hepatus epheliticus


Blue Crab, Callinectes sapidus

At this stage, fish are ready to be represented as data in the Fisheries Scientific Computing System (FSCS). This is a two-step process. First, each basket of fish is entered by genus and species name, and its number recorded in the aggregate.

Andre entering data
Andre DeBose entering initial fish data in FSCS

Then, a selection individual specimens from each basket (up to 20, if there are that many) are measured and weighed and sexed.

Andre and Emily measuring
Andre and Emily measuring and sexing fish

Occasionally researchers from particular laboratories have made special requests for species, and so we label them, bag them, and stow them in the bait freezer room.

requests
Special requests for specimens


IMG_8214
Red Snapper, Lutjanus campechanus, for Beverly Barnett

Once every animal in the trawl has been accounted for and its data duly recorded, it’s time to wash everything down and get ready to do it all over again.

porthole
Late afternoon view from the wet lab porthole


Personal Log

The key to enjoying work in the wet lab is, as I see it, the enduring promise of novelty: the possibility of surprise at finding something you’ve never seen before! For me, that promise offsets the bracing physical rigors of the work and leavens its repetitiveness. (Breathtaking cloudscapes and gorgeous sunsets do, too, just for the record. Out here on the water, there seem to be incidental beauties in every direction.) Think of the movie Groundhog Day or Camus’s “The Myth of Sisyphus” and cross either of them with the joys of beach-combing on an unbelievably bounteous beach, and you’ll have a sense of the absurd excitement of identifying fish at the sorting stage. Life in the wet lab is a lot like Bubba Gump’s box of chocolates: “You never know what you’re gonna get.”

At the next stage, data entry, the challenge for the novice is auditory and linguistic. Between the continual growl the engine makes and the prop noise of the wet lab’s constantly whirring fans, you’ve got the soundscape of an industrial workplace. Amid that cascade of sound, you need to discern unfamiliar (scientific) names for unfamiliar creatures, catching genus and species distinctions as they’re called out by your watch-mates. The good news is that the scientists you’re working with are living and breathing field guides, capable of identifying just about any animal you hold up with a quizzical look. It’s a relative rarity that we have to consult printed guides for IDs, but when we do and that task falls to me, the shell-collector kid in me secretly rejoices.

IMG_7825
I found it! Ethusa microphthalma (female)

I’m enjoying the camaraderie of my watch, led by Andre DeBose, and, as my posts suggest, I’ve had some good opportunities to pick Adam Pollack’s brain on fisheries issues. My partner in fish data-entry, Emily McMullen–an aspiring marine scientist who’ll be applying to graduate programs this fall–did this cruise last summer and has been an easy-going co-worker, patient and understanding as I learn the ropes. I’ve also had some wonderful conversations with folks like Skilled Fisherman Mike Conway, First Assistant Engineer Will Osborn, and Fisheries Biologist Alonzo Hamilton.

It’s been a busy week, as you’ll have gathered, but I’ve still managed to do some sketching. Here’s a page from my sketchbook on the CTD:

CTD
Sketch of the CTD. The main upright tanks, I learned, are Niskin Bottles

And here’s a page from my journal that pictures three species we saw quite often in the western Gulf:

Longspined Porgy - Butterfish - Brown Shrimp
Longspine Porgy (Stenotomus caprinus), Butterfish (Peprilus burti), and Brown Shrimp (Farfanepenaeus aztectus)

Had I the time, I’d sketch the rest of my “Top 10” species we’ve seen most commonly in the western Gulf. That list would include (in no particular order): the Paper Scallop, Amusium papyraceum; Lookdown, Selene vomer; Blue Crab, Callinectes sapidus; Squid, Loligo; Lizardfish, Synodus foetens; Croaker, Micropogonias undulatus; and Red Snapper:

Red Snapper
Presented for your inspection: Red Snapper, Lutjanus campechanus

Did You Know?

Four of the species visible on the surface of this basket have been identified in the blog post you’ve just read. Can you ID them? And how many of each would you say there are here on the surface?

Basket of fish
Basket of fish


 Look for a key in my next blog post.


Michelle Greene: Getting Ready for a Big Adventure, July 18, 2018

NOAA Teacher at Sea

Michelle Greene

Aboard NOAA Ship Gordon Gunter

July 19 – August 3, 2018


Mission: Cetacean Survey

Geographic Area: Northeast U.S. Atlantic Coast

Date: July 18, 2018


Latitude: 34° 18.967′ N

Longitude: 79° 52.047′ W

Temperature: 89° F (32° C)

Tomorrow is the big day!  I am getting ready to board the plane from Florence, SC to Charlotte, NC to Providence, RI.  I have never been to Rhode Island, so this is going to be a bucket list activity to keep adding states to my history.  Rhode Island will make state number 24…almost half way!

I teach in a very rural high school in Lamar, South Carolina which is approximately 90 miles from Myrtle Beach.  Lamar High School has about 280 students.  This year we had a graduating class of 52 students.  I teach Calculus, Statistics, and Algebra 2 Honors.

Teaching statistics is the main reason I applied to the Teacher at Sea program.  I wanted to give my students some real world experience with statistics.  I try to create my own data for students, but I end up using the same data from the Census, Bureau of Labor Statistics, Major League Baseball, etc.  I had one student a couple of years ago in Algebra 2 Honors who is a weather lover.  His favorite website is NOAA, and he would give me the daily weather or hurricane updates.  Any time we had a baseball game, he would be able to tell me if we were going to be able to play the game.  Being able to provide him and his classmates projects using data from something he loves will help me to reach that one student.  Hopefully, I might even spark interest in other students.

Helping my students to become statisticians is the main reason I applied; however, I also applied to challenge myself.  Throughout my life, I have not been the kind of person who deals well with creepy crawly things.  Being on a ship on the ocean will definitely force me to deal with that.  I want to do my very best to get involved in all kinds of neat activities.  I hope “Cool Beans!” will be my daily saying.

I am really looking forward to working with the scientists on the Gordon Gunter.  Having read as much as I can about the Passive Acoustic Research Group has helped me to understand a little of what we will be doing on our 15-day journey.  I hope that I can help them to further their research to learn the patterns that cetaceans use to communicate with each other!

Meredith Salmon: Xtreme XBTs, July 14, 2018

NOAA Teacher at Sea

Meredith Salmon

Aboard NOAA Ship Okeanos Explorer

July 12 – 31, 2018


Mission: Mapping Deep-Water Areas Southeast of Bermuda in Support of the Galway Statement on Atlantic Ocean Cooperation

Geographic Area:  Atlantic Ocean, south of Bermuda

Date: July 14, 2018

Weather Data from the Okeanos Explorer Bridge – July 14, 2018

Latitude: 28.58°N

Longitude: 65.48°W

Air Temperature: 27.4°C

Wind Speed:  13.96 knots

Conditions: Rain and clouds

Depth: 5183 meters


Science and Technology Log

Temperature and salinity are two main variables when determining the density of water. The density of water or any acoustic medium is a very important factor in determining the speed of sound in water. Therefore, temperature data collected by Expendable Bathythermograph (XBT) probes, as well as historical salinity profiles from the World Ocean Atlas, are used to create sound velocity profiles to use to correct for sound speed changes in the water column.

Expendable Bathythermograph (XBT) probes are devices that are used to measure water temperature as a function of depth. Small copper wires transmit the temperature data back to the ship where it is recorded and analyzed. At first, I was surprised to learn that temperature data is such an important component of multibeam mapping operations; however, I learned that scientists need to know how fast the sound waves emitted from the sonar unit travel through seawater. Since these probes are designed to fall at a determined rate, the depth of the probe can be inferred from the time it was launched. By plotting temperature as a function of depth, the scientists can get a picture of the temperature profile of the water.

On our expedition, we have been deploying XBTs on a schedule as the ship is making its way to the survey area. The XBT Launcher is connected to a deck box, which translates information to computer systems onboard so the data can be logged when the probes are deployed into the water. Aboard the Okeanos Explorer, up to 8 tubes can be loaded at one time and launched by scientists.

XBT closet in the Dry Lab


XBT Launcher
XBT Launcher on the Okeanos
xbt 2
Loading the XBT Launcher


xbt 1
Savannah and I after a successful XBT load


XBT Data
XBT Data from a launch aboard the Okeanos Explorer. The colors on the graph indicate the XBT number and the data is plotted on a temperature and depth scale.


 In addition to launching XBTs and collecting data, we completed a Daily Product so that we can communicate the data we have collected to anyone on shore. The Daily Products are completed not only to ensure that the hydrographic software systems are working correctly but to also inform the public our current location, where we have collected data, and if we are meeting the objectives of the mission. Once onshore, NOAA uses this information to analyze the quality of the data and use it for analysis for dive planning. In order to generate the Daily Field Products, we use hydrographic computer systems such as QPS Qimera for advanced multibeam bathymetry processing, Fledermaus for 4D geo-spatial processing, and Geocap Seafloor for digital terrain modeling. In addition, the Daily Field Products allow us to double check the quality of the data and search for any noise interferences due to the speed of the ship or the type of seafloor bottom (hard vs soft).


Personal Log

One of the coolest parts of learning aboard the Okeanos Explorer is the fact that I am a part of scientific exploration and discovery in real time.  Known as “America’s Ship for Ocean Exploration,” the Okeanos Explorer is the only federally funded U.S. ship assigned to systematically explore our largely unknown ocean for the sole purpose of discovery and the advancement of knowledge. This is the first U.S.-led mapping effort in support of the Galway Statement on Atlantic Ocean Cooperation and all of this information is going to be available for public use. Not only do I get the opportunity to be involved with “real-time” research, but I am also responsible for communicating this information to a variety of different parties on shore.

Being immersed in the “hands-on” science, learning from the survey techs and watch leads, and observing all of the work that is being done to collect, process, and analyze the data is a really exciting experience. I am definitely out of my element when it comes to the content since I do not have any prior experience with seafloor mapping, sonars, etc., but I am really enjoying playing the role as the “student” in this situation. There is definitely a lot to learn and I am trying to soak it all in!


Did You Know?

XBTs contain approximately 1,500 meters of copper wire that is as thin as a strand of hair!


Resources: 

http://www.aoml.noaa.gov/phod/goos/xbtscience/news.php

https://oceanexplorer.noaa.gov/facts/xbt.html

Meredith Salmon: Setting Sail! July 12, 2018

NOAA Teacher at Sea

Meredith Salmon

Aboard NOAA Ship Okeanos Explorer

July 12 – 31, 2018


Mission: Mapping Deep-Water Areas Southeast of Bermuda in Support of the Galway Statement on Atlantic Ocean Cooperation

Geographic Area:  Atlantic Ocean, south of Bermuda

Date: July 12, 2018

Weather Data from the Okeanos Explorer Bridge – July 12, 2018

Latitude: 32.094°N

Longitude: 69.591°W

Air Temperature: 26.2°C

Wind Speed:  10.7 knots

Conditions: Sunny

Depth: 693 meters

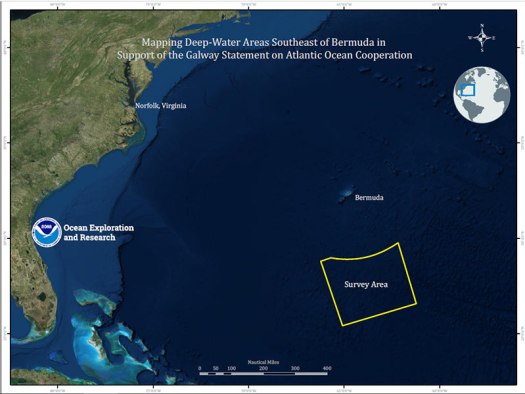
Survey Area
Map showing the planned operations area for the expedition outlined in yellow. Image courtesy of the NOAA Office of Ocean Exploration and Research.

Science and Technology Log

According to the Oceanic Institute, the oceans cover 71% of the Earth’s surface. This is calculated to be 335,258,000 square kilometers! Recently, the Okeanos Explorer mapped over 1,000,000 square kilometers of the seafloor using high- resolution multibeam sonar. Although this may not seem like much, that region is larger than the areas of Arizona and Texas combined!

So why is it so important for the Okeanos Explorer to map the seafloor? The ocean’s terrain plays a very important role in ecosystems since underwater valleys determine currents and weather patterns, sea topography influences fishery management, and seamounts serve as protection against unpredictable storms. Therefore, high-resolution maps allow scientists to categorize marine habitats, provide information vital to protecting and tracking marine life, and enable us to make smart decisions for solid, sustainable conservation measures.

In order to successfully map the ocean floor, multibeam sonar is used. The Okeanos Explorer uses an EM 302 multibeam system that is designed to map a large portion of the ocean floor with exceptional resolution and accuracy. The EM 302 transducers point at different angles on both sides of the ship to create a swath of signals. Transducers are underwater speakers that are responsible for sending an acoustic pulse (known as a ping) into the water. If the seafloor or object is in the path of the ping, then sound bounces off the object and returns an echo to the transducer. The EM 302 has the ability to produce up to 864 depth soundings in a single ping. The time interval between the actual signal transmission and arrival of the return echo (two way travel time) are combined with a sound velocity profile to estimate depth over the area of the swath. In addition, the intensity of the return echo can be used to infer bottom characteristics that can be utilized for habitat mapping. Since the EM 302 creates high density, high-resolution data as well as water column features, this sonar system is ideal for exploring the seabed for geographic features.

The image below shows data being collected by the multibeam sonar on the Okeanos Explorer. The colors are used to indicate swath depth (warm colors indicate shallow waters while cool colors indicate deeper waters).

Multibeam sonar data
Multibeam sonar data including backscatter (lower left), depth (upper center) and water column data (lower center) from 7/12/2018 the Okeanos Explorer


As this data is being collected, it must be “cleaned” to eliminate any erroneous points.  Data is collected and cleaned in both the Dry Lab and Mission Control Room.

Dry Lab
Dry Lab, equipped with 12 computer monitors, used to process data onboard the Okeanos Explorer
Mission Control
Mission Control Room aboard the Okeanos Explorer


Since we have not reached the survey area yet, we have been monitoring the depth of our path thus far. We are collecting transit data which is considered to still be valuable data for unmapped seafloor area, but it may not be as high quality as focused mapping data. We will continue to collect transit data until we reach the survey area near Bermuda.

Personal Log

Life onboard the Okeanos Explorer has been a very interesting and fun learning experience! The ship runs on a 24/7 operation schedule and people are working diligently at all hours of the day. Everyone on the ship has been really welcoming and willing to share their stories and insights about their careers at sea. I am really looking forward to speaking with more people to learn about their experiences!

We set sail out of Norfolk today and began our 3.5 day/4 day transit to the survey area near Bermuda. This morning, we found out that we will need to schedule an emergency dry dock towards the end of our mission to solve an issue with a stern thruster necessary for ROV cruises. As a result, we will not be ending up in port in St. George, but we will still be able to map the area 200 nautical miles off the coast of Bermuda, so that is great!

norfolk out to sea!
NOAAS Okeanos Explorer (port quarter aspect) navigating the Elizabeth River outbound for sea from the NOAA pier in Norfolk, VA on July 12, 2018. [Photo by Commander Briana Hillstrom, NOAA

Did You Know?

Sonar is short for Sound Navigation and Ranging.

Check out this video for a visual representation of the process sonar uses to generate data! https://oceanservice.noaa.gov/caribbean-mapping/mapping-video.html


Resources:

https://www.oceanicinstitute.org/aboutoceans/aquafacts.html

https://oceanexplorer.noaa.gov/okeanos/one-million/welcome.html

David Knight: Work Out and Work Up: Part II, July 18, 2018

NOAA Teacher at Sea

David Knight

Aboard NOAA Ship Pisces

July 10-23, 2018

Mission: Southeast Fishery-Independent Survey

Geographic Area: Southeastern U.S. coast

Date: July 18, 2018

Weather Data from the Bridge:

Latitude: 29° 45.3′

Longitude: 80° 22.5′

Sea wave height: 1-3 ft

Wind speed: 5 kts

Wind direction: 241

Visibility: 10 nm

Air temperature: 28 °C

Barometric pressure: 1014.9 mb

Sky: Scattered Clouds


Science and Technology Log

Part II. DNA, Gonads, and Diet

DNA Samples.

Certain fish that we collect have samples of their fins collected for DNA testing. For example, if a Spotfin Butterflyfish (Chaetodon ocellatus) is brought up in a trap, a small pair of scissors are used to clip a portion of its anal fin in order to obtain a sample that is then place in a micro-test tube containing a buffer. Back in the on-shore lab, technicians will obtain the DNA, which is then used to determine the genetic make-up of the population in a particular area.

Fin clip
Fin clip sample from Spotfin Butterfly fish. (photo by David Knight)

One may assume that the genetic make-up of a population is uniform across the east coast, after all, fish can swim, right? However, that is not necessarily the case. Changes in the frequency of particular alleles create spatial differences in some stocks of fish over a broad area. In other words, there may be slight genetic differences in a population of Gray Triggerfish off of the coast of North Carolina compared to those found in the waters of Florida.

Why does this matter? Currently, the management of most fish occurs over a broad area, often including many states. By understanding the slight differences that may be present in a smaller subset of a population, scientists can create better, more accurate management plans instead of a “one size fits all” model.

Gonads.

As written in an earlier blog, many fish in this region are sequential hermaphrodites and change sex during their life-time, starting off as females, then changing to males.  By taking the gonads of certain species, scientist can determine if the fish is male or female, and taken together with size and age, it is possible to estimate when these fish are transitioning from one sex to another.

Ovaries from a Vermilion Snapper
Ovaries from a Vermilion Snapper – I made a small incision so you can the eggs. (photo by David Knight)

By sampling the ovaries of fish, it is possible to estimate the fecundity of the species. Fecundity is the reproductive potential an organism possesses. The number of eggs in an ovary can be estimated and then, taking the age and size data of the specimen, it is possible to predict the potential a population has for growth. Many factors, such as the number of males in a population and the season, can influence the reproductive behaviors of fish, so sampling the gonads provides an additional pieces of data.

Finally, sampling the gonads of fish can help determine the sex ratio in the population. In fish that display sequential hermaphroditism, such as the Black Sea Bass, the number of males in the populations increase with age.

Question: Fisherman will be able to get more money for larger fish, so naturally they will want to “select for” larger fish, potentially decreasing the number of reproductive males in the population. If the number of large, reproductive males in a population decreases, then more females will transition to become male.

What may happen to the average age of sex transition in sequential hermaphrodites?

Diet.

A select few species have their stomach contents sampled. If we know what a particular species is eating, then we are able to understand the trophic interactions within the ecosystem much better. An ecosystem-based management plan will look at the interactions taking place between the many prey and predator species, whom are often competing for the same resources.  Because the diverse species in an ecosystem are inextricably linked, an increase in one species is likely to affect the other. If one species is over-fished or not reproducing at its potential, this may create a ripple effect throughout the ecosystem.


Personal Log

The food on board the NOAA Ship Pisces has been great. The Stewards, Rey and Dana, have kept us well fed with a variety of great meals. We’ve had everything from hot dogs and hamburgers to bacon wrapped filet mignon and shrimp, and a crew favorite, Taco Tuesday! Meal time is very important because not only is the crew refueling for work, but it affords them a chance to sit down, talk, and to catch up on Chip and Joanna Gaines’ newest “Fixer Upper” on the TV that runs continuously. The first day on board, Operations Officer, Lieutenant Jamie Park, told me that any NOAA ship runs on two very important things: 1) diesel fuel, and 2) COFFEE.  The galley is open 24-7 with snacks and drinks always available since crew members are working in shifts, with some getting off at midnight or 4 a.m.. And…., I recently found the freezer that contains Klondike Bars, popsicles, ice cream, and Hot Pockets.


This slideshow requires JavaScript.

Did You Know?

The Red Snapper (Lutjanus campechanus) gets its name from its enlarged canine teeth. According to the 2016 stock assessment of South Atlantic red snapper, the stock is overfished and subject to overfishing, but is rebuilding.  Management plans in the South Atlantic and Gulf of Mexico place annual catch limits on both commercial and recreational fisherman to decrease the pressure on the fish, as well as minimum size restrictions to protect young and juvenile snapper. Red Snapper can live over 50 years and are of reproductive age as early as two.

range of red snapper
Range of Red Snapper-South Atlantic (NOAA)
Site Map
Sites where traps were set. 32 nautical miles southeast of Cape Fear, North Carolina. Blue indicates deep water, Red indicates more shallow water. (image by Nate Bacheler)
snapper_red2_locationmap
Range of Red Snapper-Gulf of Mexico (NOAA)

Reference:

NOAA Fisheries. https://www.fisheries.noaa.gov/species/red-snapper


David Tourtellot: The Speed of Sound, July 15, 2018

NOAA Teacher at Sea

David Tourtellot

Aboard NOAA Ship Thomas Jefferson

July 9-26, 2018

Mission:  Hydrographic Survey – Approaches to Houston

Geographic Area of Cruise: Gulf of Mexico

Date: July 15th, 2018

Weather Data from the Bridge

Latitude: 28° 49.4115’N

Longitude: 93° 37.4893’W

Visibility: 10+ Nautical Miles

Sky Condition: 4/8

Wind: Direction: 240°, Speed: 7 knots

Temperature:

Seawater: 31.7°C

Air: Dry bulb:31.5°C          Wet bulb: 27.5°C


Science and Technology Log


NOAA Ship Thomas Jefferson is well underway in its mission of surveying the seafloor. The primary tool that the ship (as well as its 2 Hydrographic Survey Launches) is using to accomplish this task is sonar. Sonar was originally an acronym for SOund Navigation And Ranging. If you are familiar with echolocation – the system that some animals (such as bats and dolphins) use to navigate their surroundings – then you already have a basic understanding of how sonar works. The sonar transmits a short sound (called a ping) that will travel down, away from the ship, until it hits the seafloor. At this point, it will reflect off of the sea floor, and echo back up to the ship, where it is detected by the sonar’s receiver. The crew aboard are then able to calculate the depth of the water.

To make the necessary calculations, there are 3 variables at play: the time that it takes for the ping to travel; the distance that the ping travels; and the velocity, or the speed, at which the ping moves through the water. If we know two of those variables, it is easy to calculate the third.

When using sonar to determine the depth of the water, distance is the unknown variable – that’s what we’re ultimately trying to figure out. To do so, we need to know the other two variables. Time is an easy variable for the sonar to measure. The sonar has a transmitter, which generates the ping, and a receiver, which hears it. These two components communicate with one another to give us an accurate measure of time. The third variable, velocity, is a bit trickier.

In saltwater, sound travels approximately 1500 meters per second. However, that rate can vary slightly based on water conditions such as temperature and salinity (how salty the water is). In order for sonar to get as accurate a reading as possible, it needs to calculate the precise speed of sound for the particular water it is in at the moment. The sonar is able to do that by using a component called a sound velocity sensor, known colloquially as a singaround.

Sonar 1 Singaround
The sonar on the hull of one of the Hydrographic Survey Launches. The orange rectangles are the projector (or, the transmitter) and the receiver, and the component in the green circle is the singaround

A singaround looks like a bar with a nub on each end. One nub is a projector, and the other is a reflector. The projector broadcasts a ping that travels parallel to the hull of the ship, bounces off of the reflector, and returns to the projector. We use that information to calculate velocity. The calculation uses the same 3 variables as above (time, distance, and velocity), but this time, distance isn’t the unknown variable anymore – we know exactly how far the ping has traveled, because we know how far the projector and reflector are from one another. The singaround electronically measures how long it takes for the ping to travel, and since we now know two of the variables (distance and time) we can calculate the third (velocity) for our particular water conditions at the face of the sonar.

Sound travels roughly 4 times faster in water than it does in air (this is because water is denser than air). To ensure that the sonar gets an accurate reading, it is important that air bubbles don’t get in the way. The boat’s hull (bottom) has a triangular metal plate directly in front of the sonar, which routes air bubbles around to the side of the sonar.

Sonar 2
The hull of one of the Hydrographic Survey Launches.


Personal Log

Each day, the ship’s CO (Commanding Officer) publishes a POD, or Plan Of the Day. This is full of important information – it tells us what the ship will be doing; if/when we will deploy the launch boats, and who will be on them; what time meals will be; and the expected weather conditions. Below is an example from Friday, July 13th.

Plan of the Day
NOAA Ship Thomas Jefferson Plan of the Day for Friday, July 13, 2018

On Friday, I had the opportunity to go out on one of the Hydrographic Survey Launches. Because of their smaller size, the launch boats are great for surveying difficult to maneuver areas. For instance, we spent most of the day surveying an area near an oil rig, and were able to get much closer than the Thomas Jefferson could.

Mike Below Deck
Survey Tech Mike Hewlett collecting and analyzing survey data aboard a launch boat
Oil Rig and Boat
An oil rig and a supply vessel

I’ve been very impressed by how multi-talented everyone on the ship seems to be. In addition to analyzing data, the ship’s survey techs can also be found handling lines as the survey boats are launched and recovered, and do a lot of troubleshooting of the hardware and software they’re using. The coxswains (people who drive small boats) double as engineers, fixing issues on the launch vessels when away from the ship. I’m surrounded by some very gifted people!

Fixing the AC
Coxswain Francine Grains and Survey Tech Brennan Walters fixing the air conditioner on one of the launch boats that had stopped working unexpectedly. They had it up and running in no time

Did you know?: As president, Thomas Jefferson ordered the first survey of the coastline of the United States. Because of this, NOAA Ship Thomas Jefferson is named for him. 

Latest Highlight: While surveying, we spotted a water spout in the distance. A water spout is a tornado that forms over water. Luckily, we were a safe distance away. It was an amazing sight to see!


David Knight: Work Out and Work Up: Part I, July 17, 2018

NOAA Teacher at Sea

David Knight

Aboard NOAA Ship Pisces

July 10-23, 2018


Mission: Southeast Fishery-Independent Survey

Geographic Area: Southeastern U.S. coast

Date: July 17, 2018

Weather Data from the Bridge:

Latitude: 30° 30.2 N
Longitude:
80° 15.6 W
Sea wave height:
1-2 ft
Wind speed:
15 kts
Wind direction:
187°
Visibility:
10 nm
Air temperature:
30.1 °C
Barometric pressure:
1014.7 mB
Sky:
Broken Clouds

Science and Technology Log

Warning!!! Great Science Ahead…


Part I.

Waiting to see
Waiting to see what the traps have brought up this time… (photo by David Knight)

As fish traps begin to be brought up by the deck crew, scientist wait to see what may be in the trap. I’ve actually found that I am looking over the deck in anticipation of new fish that may have been caught, or to see how many fish will need to be “worked up.” Once the fish have been removed from the trap and emptied into a large bin, they are then sorted by species into 17-gallon bins to determine the total weight of all fish.  Moving 17 gallons worth of fish up to the lab bench to the scale can be quite a “work out.” There have been a couple of hauls that have captured so many fish of a particular species that more than one bin has to be used. After the fish have been weighed, the total length of each fish is determined to get a length frequency of the entire catch.  For species like Tomtate (Haemulon aurolineatum), every fish is measured and then returned to the ocean. For some species, a pre-determined percentage are kept for a more detailed work up that may include the extraction of otoliths, removal of gonads, or a collection of stomach contents. The data collected from each fish will then be used by scientists in a number of different agencies and in different states to better understand the growth and reproduction of the particular species. All of this data is then used to create management plans for economically and ecologically important fish as well as to gain a better understanding of its life history.

Work Up

Length.

Measuring fish
Measuring the length of each, individual fish. (photo taken by Nate Bacheler)

One may assume that a very long fish is also very old, but that is not necessarily the case. The length of a fish is not a good way to determine the age of a fish because factors such as temperature and food availability may alter the growth rate. Many fish grow very rapidly early on, but then slow their growth, so it is possible that a fish that is twelve years old is the same size as a fish that is three years old. Because many fish demonstrate logistic growth rates in terms of length, it is important to use additional pieces of data to determine their age.

Otolith.

In the head of ray-finned fish, one can find small, bone-like structures called otoliths. These structures have a variety of sensory functions that include detection of sound vibrations in water, movement, and its orientation in the water. As fish age, calcium carbonate will be added to the otolith, forming ring-like structures that can be used to determine the age of a fish, much like a tree will add new tissue each season forming tree rings.  Otoliths are the best way to determine the actual age of a fish.

IMG_6677
Otoliths. [left to right: Black Sea Bass, Red Snapper, Jackknife fish] (photo by David Knight
For the fish that we were sampling, we remove the sagittal otoliths which are located beside the brain just about level with the eyes. To extract them, a cut is made on the dorsal side of the fish with a sharp knife to gain access to the skull case.  To extract otoliths from some very “hard-headed” fish, a saw is used, while others take little effort. After a few hours of otolith extraction, I feel as though I am getting the hang of it, although I am nowhere near as fast as the biologist on board! I’ve been collecting otoliths from Black Sea Bass (Centropristis striata) and Vermillion Snapper (Rhomboplites aurorubens) to bring home with me to create a lab for my class and to post on the NOAA Teacher-at-Sea website.

Extracting otolith
Looking for a perfect extraction of otolith from Vermilion Snapper. (photo taken by Nate Bacheler)

Be sure to check back for Part II. Gonads, Diet and DNA


Personal Log

The motion of the ship has not been a problem so far and I stopped taking any motion sickness pills after the first day. As I have been removing otoliths from fish, I cannot help but think about the similarities in how both fish and humans perceive their spatial environment and maintain balance. In our vestibular system, we too have otoliths that help to sense acceleration in a vertical and horizontal direction. Of course my thoughts then go to a dark place…what if someone were removing my otoliths to determine my age?


Did You Know?

The longest known life span in vertebrates is found in the Greenland Shark (Somniosus microcephalus). It is estimated that the Greenland shark grows less than 1 cm per year. Since sharks do not have otoliths, scientist have to analyze proteins found in the lens of their eye.  In 2016, scientist from the University of Copenhagen collected a 5 m shark that was estimated to be about 392 years old, but may be anywhere from 272 to 512 years old.

Reference: Eye lens radiocarbon reveals centuries of longevity in the Greenland shark (Somniosus microcephalus). Science  12 Aug 2016: Vol. 353, Issue 6300, pp. 702-704

David Knight: Getting to Know the Pisces, July 16, 2018

NOAA Teacher at Sea

David Knight

Aboard NOAA Ship Pisces

July 10-23, 2018

Mission: Southeast Fishery-Independent Survey

Geographic Area: Southeastern U.S. coast

Date: July 16, 2018

Weather Data from the Bridge:

Latitude: 32° 49.6
Longitude: 78
° 52.4
Sea wave height: 1-2 ft
Wind speed: 10 kts
Wind direction: 59
Visibility: 10 nm
Air temperature: 28.7
°C
Barometric pressure: 1016.9 mb
Sky: Clear

An Interview with Ensign Luke Evancoe

Pisces logo
NOAA Ship Pisces Seal

My first day on NOAA Ship Pisces I was introduced to about 300 different people. Well, maybe it was more like 30, but it sure seemed like a lot of people were aboard.  NOAA vessels have civilian personnel that perform a myriad of important duties, scientists that assist in planning and carrying out the various missions of the ship, and commissioned NOAA Corps Officers that ensure the mission of NOAA is carried out.

Engineers are responsible for making sure that all of the systems on the ship are operating properly.  The engineers must be able to fix and maintain all mechanical, electrical, and plumbing systems on the ship.  It’s this important group that makes sure the A/C is working in our cabins and that the propulsion system gets us from one trap site to the next.  Members of the deck department use equipment to lower CTD units, bring up traps, deploy and retrieve buoys, and maintain watches throughout the day.  These men and women are responsible for making sure very expensive equipment is safely and effectively used. As a research vessel, the Survey department’s role in the acquisition and processing of oceanographic and survey data is crucial. These individuals operate and analyze data from a number of different pieces of equipment including the CTD and the multibeam echosounder.  And finally, there are the Stewards. The stewards are the ones responsible for making sure everyone is well fed and comfortable. They prepare and plan all meals, ensure the pantry is stocked and ready for each mission, and that all of the common areas are clean and sanitary.

Soon after boarding, I met Ensign Luke Evancoe, the newest NOAA Corps Officer to join the NOAA Ship Pisces. After talking to him briefly and learning about his varied background and the circuitous route that brought him to NOAA, I decided I wanted to interview him and find out more about his role as a NOAA Corps Officer.

IMG_6592
Ensign Luke Evancoe, NOAA Ship Pisces newest NOAA Corps Officer

Where are you from and what did you do before coming to NOAA?

I grew up in Pittsburgh and have a B.S. in Biology and Masters in Teaching from Virginia Commonwealth University in Richmond, Virginia. After high school and two years of college, I decided to join the United States Marine Corps and become an Infantryman. While in the Marine Corps I was a member of the USMC Silent Drill Platoon, a 24-member team that are ambassadors of the USMC that perform at sporting events and parades. I was then deployed to Afghanistan for seven months. I was a vehicle commander for an MRAP (Mine-Resistant Ambush Protected) vehicle.

After the Marine Corps, Mr. Evancoe went back to VCU and then became a sixth grade science teacher at the Franklin Military Academy in Richmond, Virginia where he taught for two and one half years. While at a research symposium, he learned about the work of NOAA and the NOAA Corps and decided to apply to the program and once he was accepted, left teaching to train to become an NOAA Corps Officer.

What was a memorable experience while you were teaching?

My most memorable experience teaching was when I successfully executed an experiment to see whether the myth that if someone moves while stuck in quicksand, they sink faster than if they remained motionless was true or not. Using Hexbugs, which are tiny robot bugs, my students tested whether the Hexbugs which were turned on and “squirming” sank into a cornmeal mix (the quicksand) at a faster or slower rate than Hexbugs that were turned off. It was a simple, yet fun way to demonstrate the basics of the scientific method to middle school children.

Tell us about your training with NOAA Corps.

The NOAA Corps training lasts 19 weeks and is held at the US Coast Guard Academy in New London, Connecticut. Our training is called Basic Officer Training Class (BOTC) and is carried out alongside the Coast Guard Officer Candidates.

The training is similar to the military academies in that we wear a uniform, start our day at about 5 a.m., go to classes and are expected to carry out other duties when we are not in class. It is very regimented, but it is also rewarding.

25501_0
Ensign Evancoe (on the left, 5th from the bottom)

How is training for NOAA Corps similar to your Marine Corps training that you received?

They are really incomparable. What is similar, however, is the training you receive in leadership and discipline and how to best represent yourself as a member of a uniformed service for the United States.

What types of things do you learn during your BOTC training?

As I mentioned, we learn a lot about leadership, but we also learn about the goals and mission of NOAA and the role of officers in fulfilling that mission. Obviously, we also learn about skills that will allow us to be good seamen.  We have to know about all of the different operations of a NOAA ship like propulsion, navigation, and communication and we also learn the skills of each of the departments like engineering and the deck crew. We learn different nautical skills and about maritime regulations.  Obviously, we learn how to handle both large ships and small vessels.

The training program involves a lot of hands on opportunities beside the classroom sessions we have. It is similar to how you would teach science with some lecture time and then lab time.

You are currently an ensign, what are your duties right now?

I am considered a Junior Officer of the Deck (JOOD). I am assigned two 4-hour watches on the bridge. During this time, I am driving the ship as we transit from one location to another or as we drop and pick up traps. You have to multi-task very well. I have to be listening to the radios as the crew relays information to the bridge, the scientists also communicate with the bridge as traps are being deployed or retrieved, I have to know our speed, pay attention to the strength of the current, wind direction and its speed, I have to watch for other vessels in the area, there’s a whole lot going on. Fortunately, I am being mentored by a senior officer when I am on the bridge. All of the training I am currently doing will allow me to become an Officer of the Deck (OOD) which will allow me to be unsupervised on the bridge.

What is the most difficult aspect of driving the ship?

The most difficult aspect of driving the ship would have to be maintaining an understanding of the current state of the wind, currents, and swell, while realizing that these variables can change multiple times over the course of a watch; a strategy that I was using to pick up fish traps the first hour of watch may not work at all with how the sea state has changed an hour later.

NOAA Ship Pisces in port

In addition to my shifts on the bridge, I have collateral duties that I am learning. For instance, I am learning the duties of the Navigation Officer who is responsible for ensuring that all of the navigation charts are up to date, that the navigation equipment is working properly, and that upcoming tracklines are laid out on our charts and approved by the CO.  The Imprest Officer is responsible for managing some of the ship’s funds and making sure the wage mariners are paid when required. I am also learning about the duties of the Movie Officer. We have a large inventory of movies from the US Navy that have to be cataloged and replaced. We get movies that are still playing in theaters so crew members can use their time when they are not on duty to relax. It’s important that people can relax.  Finally, I am coming up to speed with the duties of the Property Officer, who maintains inventory of all of the ship’s electronically-based and sensitive property and accounts for assets that must be properly disposed of.

What is the OOD workbook?

It is like on-the-job training. The work that I do in the workbook helps me put into practice the things I learned at BOTC, and once I have completed the workbook and it has been approved, it will allow me to stand watch on the bridge without supervision.

The workbook assesses my knowledge of the mission and maintaining the safety and security of the ship.

What didn’t you realize before you became a NOAA officer that you discovered since joining the NOAA Corps?

I guess I did not realize that, as an officer, you have to know everyone else’s job in addition to yours. An officer is ultimately responsible for all aspects of the ship, so I have to be knowledgeable in not just navigating or driving the ship, but I also have to know about all the other departments. It’s a lot to know, but I find it very rewarding.

What are your goals with NOAA?

My commitment as a NOAA Officer is three years, but I plan on making this my career.  After my two years on NOAA Ship Pisces I will then spend time at my land based assignment.  I enjoy my job because I am involved in collecting valuable data for the scientists to analyze, there is a lot of responsibility and you have to constantly be 100% engaged in your work, and you get to see and experience amazing things while at sea.

Personal Log

There is always work to be done on the NOAA Ship Pisces, but at the end of a day there may be time to relax and to play a little Corn Hole. Sunday evening the scientific team cleared the back deck for a little tournament. Playing Corn Hole on a moving ship is quite a bit different than playing in your back yard! Just as you are getting ready to release the bag a swell will move the ship and cause your bag to miss the board—-at least that’s my story and I’m sticking to it!

Did You Know?

Pisces is the Latin word for “fish”. In Greek mythology, Aphrodite and Eros were transformed into fish to escape the monster, Typhon.