NOAA Teacher at Sea
Joan Shea-Rogers
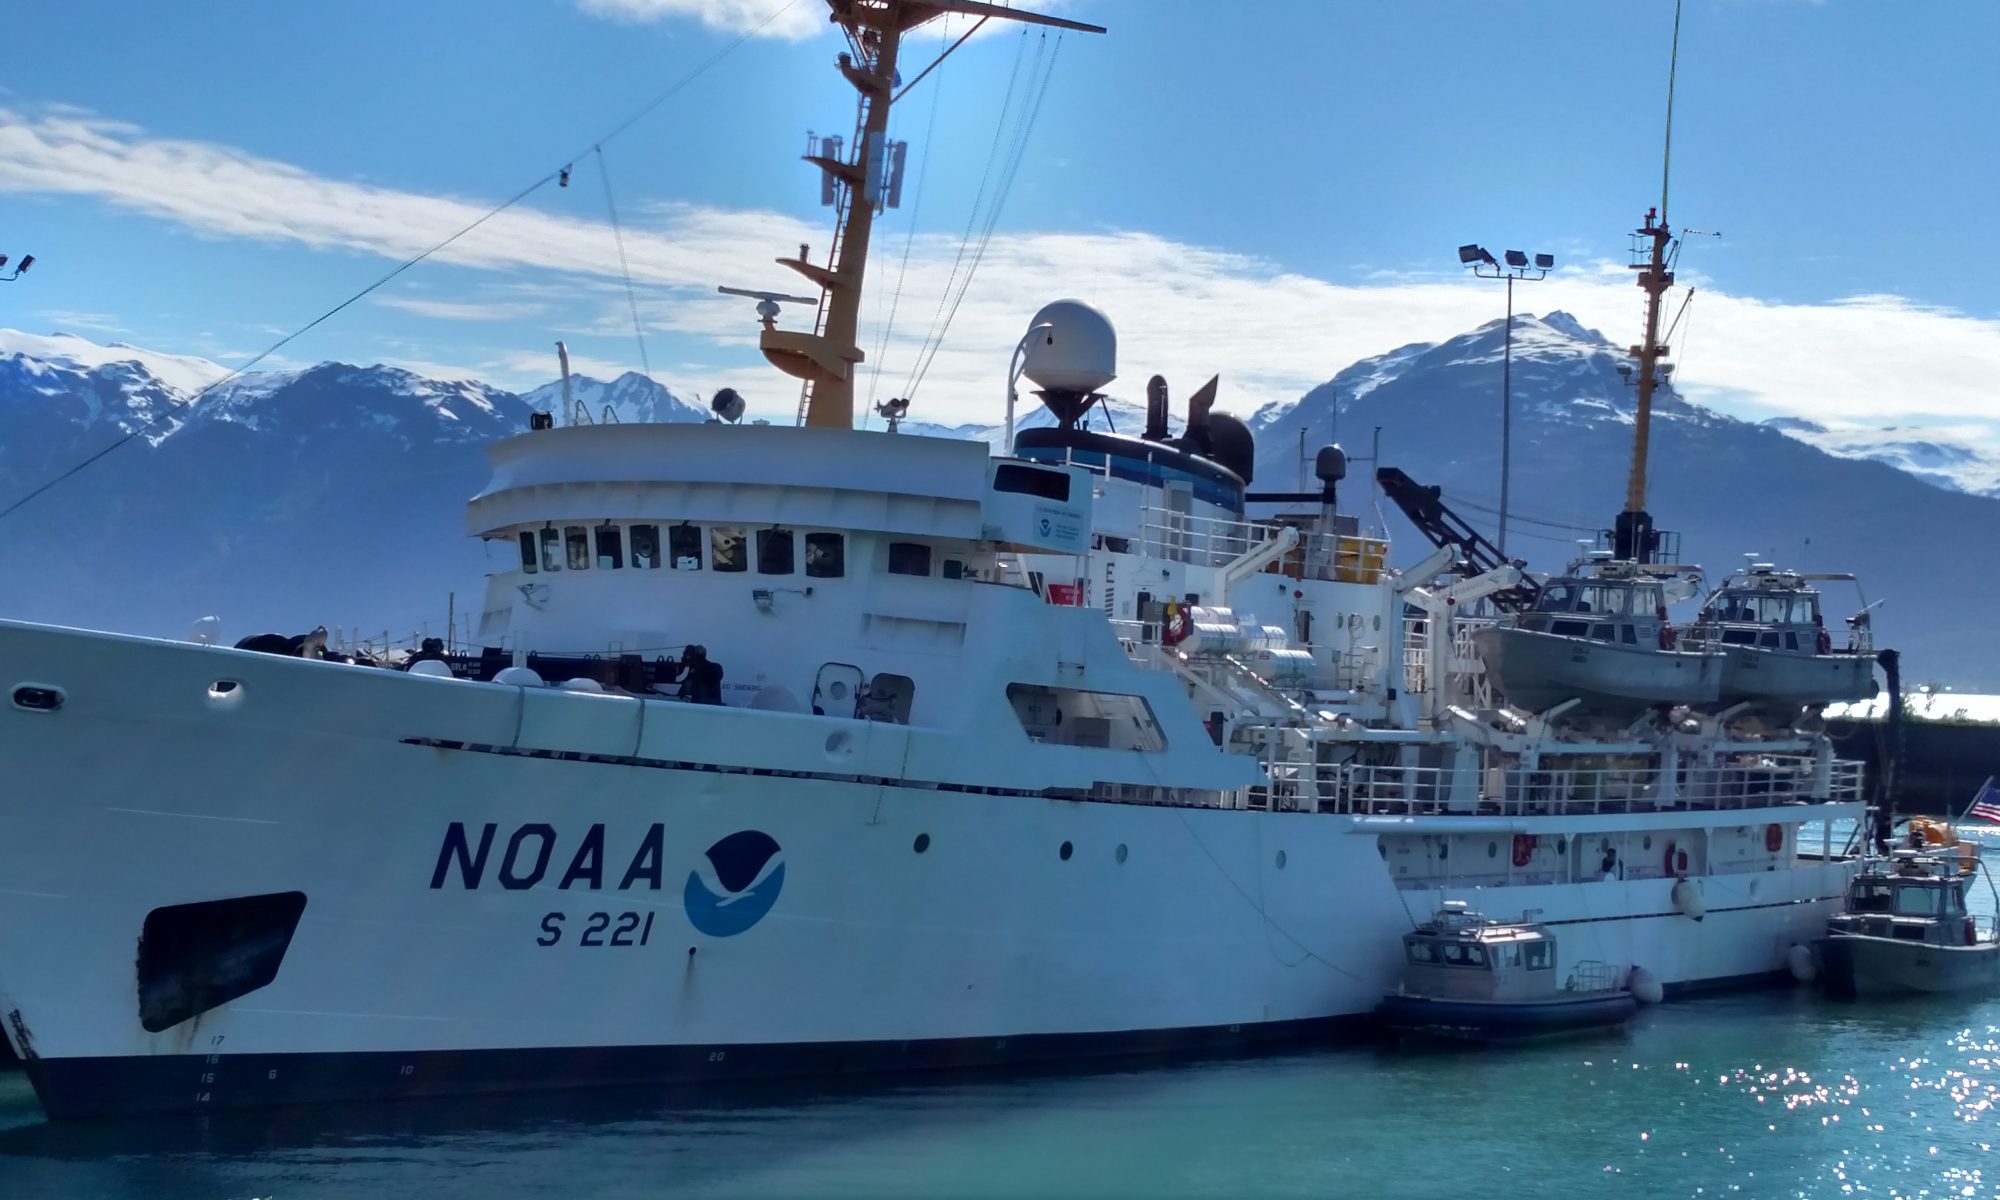
Aboard NOAA Ship Oscar Dyson
July 1-22, 2018
Mission: Walleye Pollock Acoustic Trawl Survey
Geographic Area of Cruise: Eastern Bering Sea
Date: July 10, 2018
Weather Data from the Bridge
Latitude: 53ºN
Longitude: 166ºW
Sea Wave Height: 1.5 feet
Wind Speed: 25 knots
Wind Direction: SW
Visibility: 15 Miles
Air Temperature: 52º F
Barometric Pressure: 1010.61mb
Sky: Overcast
Biological Trawl Data:

Trawl hauls are how fishing is conducted. A large net is dropped into the water for a specific amount of time. By catching exactly what is in the ocean, the acoustic backscatter can be identified (what the various colored pixels on the echograms represent). Below is an echogram on the screen, the black line is the path of the trawl through the backscatter, the little red circle indicated where the camera was, and the picture at left is pollock passing by the camera and into the back of the net at that point.

Samples of pollock and other organisms can be studied and other biological data collected. By counting, measuring, and weighing the pollock and other animals caught in each haul, calculations can estimate the amount of fish in a given area. Acoustic data can be used to determine the number of fish by dividing the measured backscatter by the backscattered energy from one fish (target strength, discussed in the last blog). That gives the number of fish:
To get the backscatter from one fish for the above calculation, we need to know the size and species of the fishes. The trawl provides that information. In the fish lab, species including pollock are identified, lengths are taken, and the number of fish at each length is entered in the computer. Also, the animals including pollock are weighed and a mean weight is determined. The number of fish computed from the acoustic and trawl data multiplied by the mean weight of a fish equals the biomass of the fish (total weight of the population in a given area).
The fisheries biologists developed the software used for all these calculations. This information coupled with the echograms can answer those earlier questions…Where are the pollock in the Bering Sea? How many are there? How big are they? How many adult pollock are there (fish that can be caught) and how many young pollock are present (providing information about future availability and how healthy the population is)?
When I first boarded the ship, I asked the fisheries biologists how they would describe what they do. They responded that they count fish, it’s not rocket science. But you know what? It kind of is!

What is this information used for?
This information is used to manage the Pollock fishery. Numerical data is given to the entities that set the fishing quotas for the Bering Sea area. Quotas are then divided up between the commercial and individual fishing companies/boats. Once fishermen reach these quotas they must stop fishing. This protects the fishery to ensure that this food source will be healthy and strong for years to come. A similar example from my home state is that of the Illinois is the Department of Conservation. One of their responsibilities is to manage the deer population. Then they can determine how many deer can be harvested each season that still allows for the deer population to thrive.
Personal Blog:
In my last blog post, I talked about preparing for and “weathering the storm”. As with most things at sea and on land, things don’t always turn out as we plan. The stormy weather began with wave heights between 8-10 feet. The ship continually rocked back and forth making walking and everything else difficult. You can tell the experienced sailors because they were much more graceful than I was. I held on to every railing and bolted down piece of furniture that I could. And even then, I would forget and place a pen on the table, which immediately rolled off. While eating I held onto my glass and silverware because as I ate and placed my knife on my plate it rolled off. Dressing was a balancing act, which I was not good at. I finally figured out it was better if I sat in a chair. Luckily for me, my patch for seasickness worked.
While I was sitting in the mess hall (dining room) an alarm rang. The engineers got up read the screen and left. The decision was made by the acting CO (Commanding Officer) that we would have to go back to Dutch Harbor. And now, as I write this, we are docked in Dutch Harbor waiting for word about the status of our voyage. Out here in Dutch Harbor, everything must be shipped in. We wait until parts and people are flown in. The fisheries biologists also have to determine the validity of the data collected on such a short voyage. They also must decide in a timely matter, can this data collection continue after returning to port?
For me, I am holding out hope that all these factors are resolved so that we can go back out to sea. Since November when I turned in my application, this voyage has been such a focal point of my life. If it doesn’t work out (I’ll try not to cry), I will still have had the adventure and learning experience of a lifetime. So here’s hoping……


