NOAA Teacher at Sea
Caitlin Fine
Aboard University of Miami Ship R/V Walton Smith
August 2 – 6, 2011
Mission: South Florida Bimonthly Regional Survey
Geographical Area: South Florida Coast and Gulf of Mexico
Date: August 4, 2011
Weather Data from the Bridge
Time: 10:32pm
Air Temperature: 30°C
Water Temperature: 30.8°C
Wind Direction: Southeast
Wind Speed: 7.7knots
Seawave Height: calm
Visibility: good/unlimited
Clouds: clear
Barometer: 1012 nb
Relative Humidity: 65%
Science and Technology Log
As I said yesterday, the oceanographic work on the boat basically falls into three categories: physical, chemical and biological. Today I will talk a bit more about the chemistry component of the work on the R/V Walton Smith. The information that the scientists are gathering from the ocean water is related to everything that we learn in science at Key – water, weather, ecosystems, habitats, the age of the water on Earth, erosion, pollution, etc.
First of all, we are using a CTD (a special oceanographic instrument) to measure salinity, temperature, light, chlorophyll, and depth of the water. The instrument on this boat is very large (it weights about 1,000 lbs!) so we use a hydraulic system to raise it, place it in the water, and lower it down into the water.

The CTD is surrounded by special niskin bottles that we can close at different depths in the water in order to get a pure sample of water from different specific depths. Nelson usually closes several bottles at the bottom of the ocean and at the surface and sometimes he closes others in the middle of the ocean if he is interested in getting specific information. For each layer, he closes at least 2 bottles in case one of them does not work properly. The Capitan lowers the CTD from a control booth on 01deck (the top deck of the boat), and two people wearing a hard hat and a life vest have to help guide the CTD into and out of the water. Safety first!
Once the CTD is back on the boat, the chemistry team (on the day shift, Lindsey and I are the chemistry team!) fills plastic bottles with water from each depth and takes them to the wet lab for processing. Throughout the entire process, it is very important to keep good records of the longitude and latitude, station #, depth of each sample, time, etc, and most importantly, which sample corresponds to which depth and station.
We are taking samples for 6 different types of analyses on this cruise: nutrient analysis, chlorophyll analysis, carbon analysis, microbiology analysis, water mass tracers analysis and CDOM analysis.
The nutrient analysis is to understand how much of each nutrient is in the water. This tells us about the availability of nutrients for phytoplankton. Phytoplankton need water, CO2, light and nutrients in order to live. The more nutrients there are in the water, the more phytoplankton can live in the water. This is important, because as I wrote yesterday – phytoplankton are the base of the food chain – they turn the sun’s energy into food.

That said, too many nutrients can cause a sudden rise in phytoplankton. If this occurs, two things can happen: one is called a harmful algal bloom. Too much phytoplankton (algae) can release toxins into the water, harming fish and shellfish, and sometimes humans who are swimming when this occurs. Another consequence is that this large amount of plankton die and fall to the seafloor where bacteria decompose the dead phytoplankton. Bacteria need oxygen to survive so they use up all of the available oxygen in the water. Lack of oxygen causes the fish and other animals to either die or move to a different area. The zone then becomes a “dead zone” that cannot support life. There is a very large dead zone at the mouth of the Mississippi River. So we want to find a good balance of nutrients – not too many and not too few.
The chlorophyll analysis serves a similar purpose. In the wet lab, we filter the phytoplankton onto a filter.

Each phytoplankton has chloroplasts that contain chlorophyll. Do you remember from 4th grade science that plants use chlorophyll in order to undergo photosynthesis to make their own food? If scientists know the amount of chlorophyll in the ocean, they can estimate the amount of phytoplankton in the ocean.
Carbon can be found in the form of carbon dioxide (CO2) or in the cells of organisms. Do you remember from 2nd and 4th grade science that plants use CO2 in order to grow? Phytoplankton also need CO2 in order to grow. The carbon dioxide analysis is useful because it tells us the amount of CO2 in the ocean so we can understand if there is enough CO2 to support phytoplankton, algae and other plant life. The carbon analysis can tell us about the carbon cycle – the circulation of CO2 between the ocean and the air and this has an impact on climate change.
The microbiology analysis looks for DNA (the building-blocks of all living organisms – kind of like a recipe or a blueprint). All living things are created with different patterns or codes of DNA. This analysis tells us whose DNA is present in the ocean water – which specific types of fish, bacteria, zooplankton, etc.
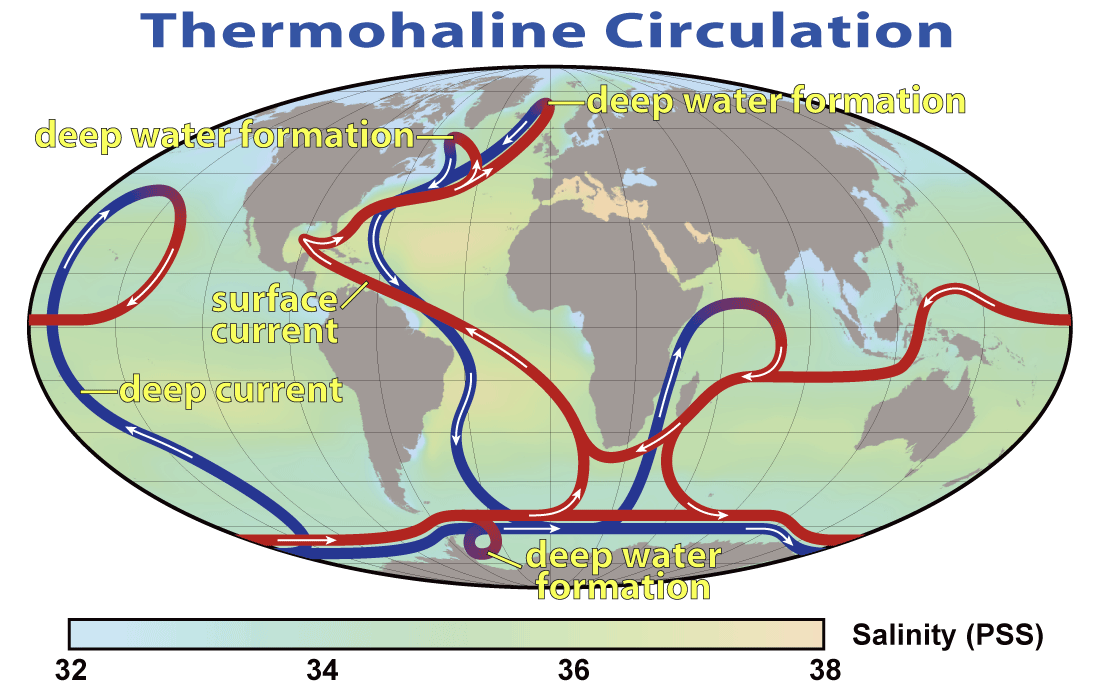
The water mass tracers analysis (on this boat we are testing N15 – an isotope of Nitrogen, and also Tritium – a radioactive isotope of Hydrogen) helps scientists understand where the water here came from. These analyses will help us verify if the Mississippi River water is running through the Florida Coast right now. From a global viewpoint, this type of test is important because it helps us understand about the circulation of ocean water around the world. If the ocean water drastically changes its current “conveyor belt” circulation patterns, there could be real impact on the global climate. (Remember from 2nd and 3rd grade that the water cycle and oceans control the climate of Earth.) For example, Europe could become a lot colder and parts of the United States could become much hotter.

The last type of analysis we prepared for was the CDOM (colored dissolved organic matter) analysis. This is important because like the water mass tracers, it tells us where this water came from. For example, did the water come from the Caribbean Sea, or did it come from freshwater rivers?
I am coming to understand that the main mission of this NOAA bimonthly survey cruise on the R/V Walton Smith is to monitor the waters of the Florida Coast and Florida Bay for changes in water chemistry. The Florida Bay has been receiving less fresh water runoff from the Everglades because many new housing developments have been built and fresh water is being sent along pipes to peoples’ houses. Because of this, the salinity of the Bay is getting higher and sea grass, fish, and other organisms are dying or leaving because they cannot live in such salty water. The Bay is very important for the marine ecosystem here because it provides a safe place for small fish and sea turtles to have babies and grow-up before heading out to the open ocean.
Personal Log
This cruise has provided me great opportunities to see real science in action. It really reinforces everything I tell my students about being a scientist: teamwork, flexibility, patience, listening and critical thinking skills are all very important. It is also important to always keep your lab space clean and organized. It is important to keep accurate records of everything that you do on the correct data sheet. It can be easy to get excited about a fish or algae discovery and forget to keep a record of it, but that is not practicing good science.

It is also important to stay safe – every time we are outside on the deck with the safety lines down, we must wear a life vest and if we are working with something that is overhead, we must wear a helmet.
I have been interviewing the scientists and crew aboard the ship and I cannot wait to return to Arlington and begin to edit the video clips. I really want to help my students understand the variety of science/engineering and technology jobs and skills that are related to marine science, oceanography, and ships. I have also been capturing videos of the ship and scientists in action so students can take a virtual fieldtrip on the R/V Walton Smith. I have been taking so many photos and videos, that the scientists and crew almost run away from me when they see me pick up my cameras!

The food continues to be wonderful, the sunsets spectacular, and my fellow shipmates entertaining. Tomorrow I hope to see dolphins swimming alongside the ship at sunrise! I will keep you posted!!
Did you know?
The scientists and crew are working 12-hour shifts. I am lucky to have the “day shift” which is from 8am to 8pm. But some unlucky people are working the “night shift” from 8pm to 8am. They wake-up just as the sun is setting and go to sleep right when it rises again.
Animals seen today…

– Many jellyfish
– Two small crabs
– Lots of plankton

– Flying fish flying across the ocean at sunset
– A very small larval sportfish (some sort of bluerunner or jack fish)


